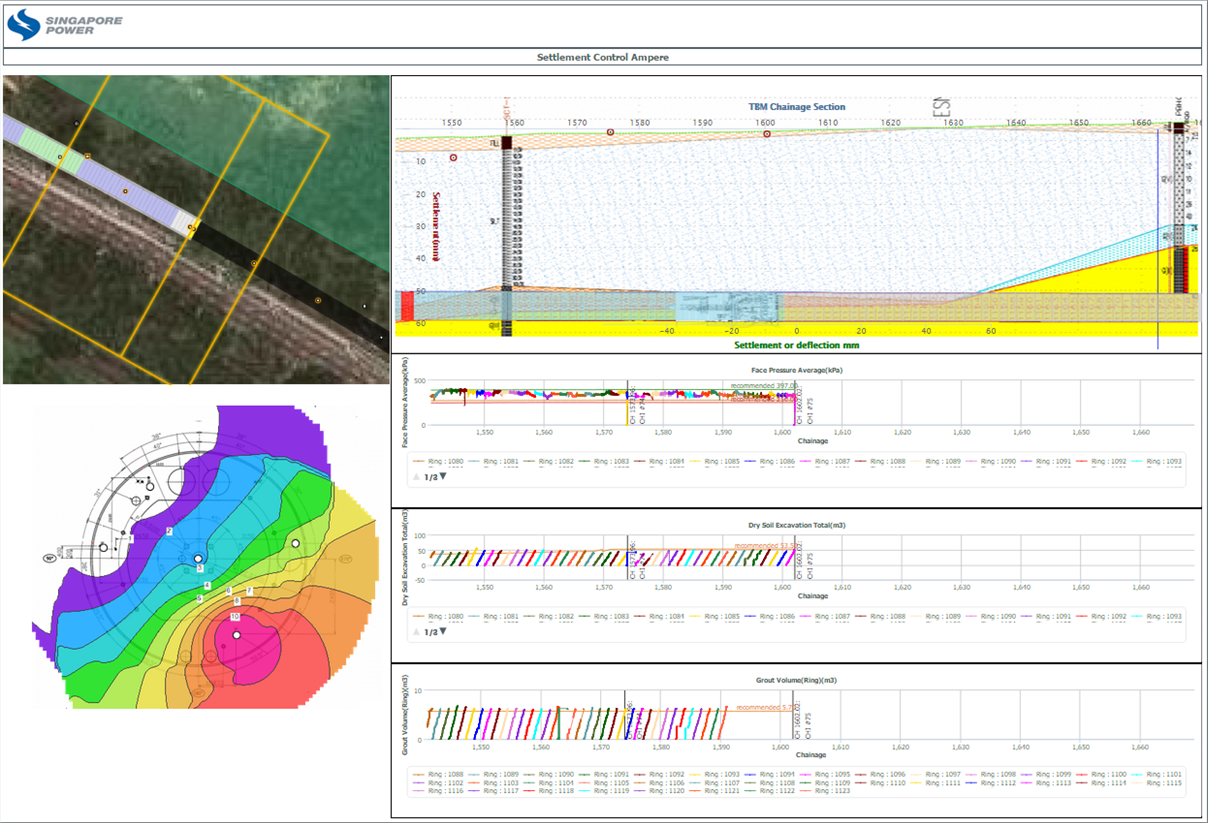
The MissionOS canvas tool gives you unparalleled flexibility to create a myriad of plots and sheets to describe aspects of your project. Each graph, map, section or plot that you produce can be saved in definition to your library from it can be arranged with other data such as fields, tables and comments. Once defined this canvas can be set to autoupdate with new data whenever called. MissionOS canvases can also be set to be auto-updated and become live control screens into key aspects of the job. These screens can be configured to take general MissionOS processed data and/or real time feeds for constriction and instrumentation dataloggers.
Canvas
Maxwell GeoSystems' MissionOS provides its clients a highly customisable report designer.
A Flexible Report Designer to enable users to design once and review many times. Auto Update ff Data. Combine any plot types with Tables, Fields, Maps and Sections. Save as Personalised Dashboards.
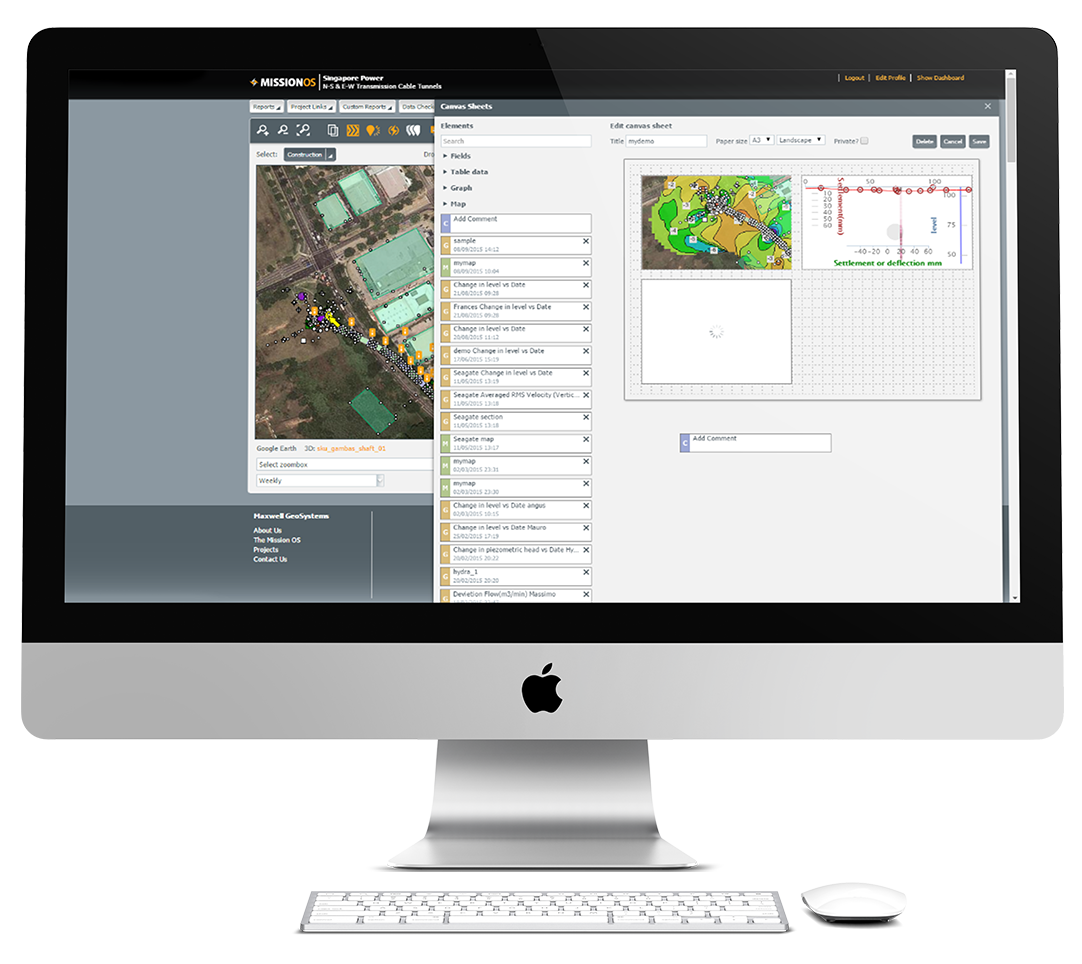
Creating MissionOS screens is as easy as click and drag an item to the canvas re-size and arrange. Interactively add comments and preview data. Screens can be shared between parties on a project and become an indispensable platform for online collaboration. Canvas screens can also be saved as automatically updating personal dashboards.
