Graphing
Graphing
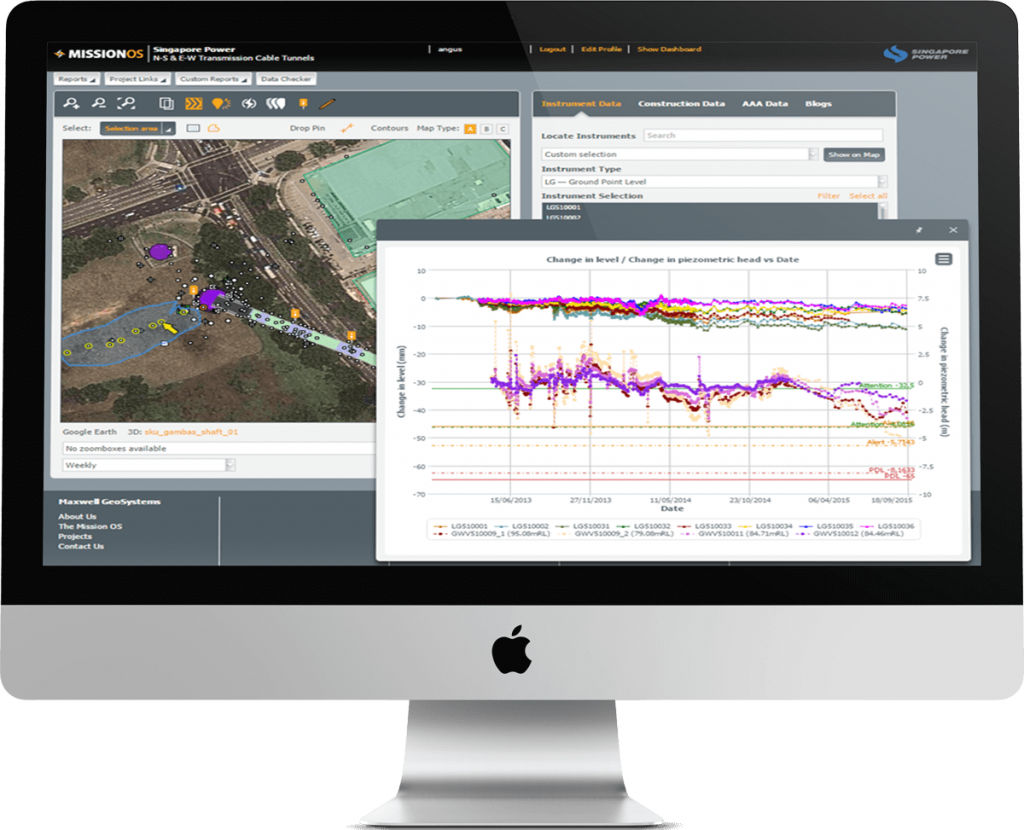
Maxwell GeoSystems’ MissionOS provides its Clients the very latest choices in dynamic graphing options.
Flexible Graphing And Analysis
Interrogate Data and Explore Relationships, Create Canvases with Multiple Related Plots Using Interactive Graphs on the Web
The MissionOS has a highly flexible graphing engine to allow you to combine data of all types with drawings, comments and programme information in powerful ways to increase understanding.
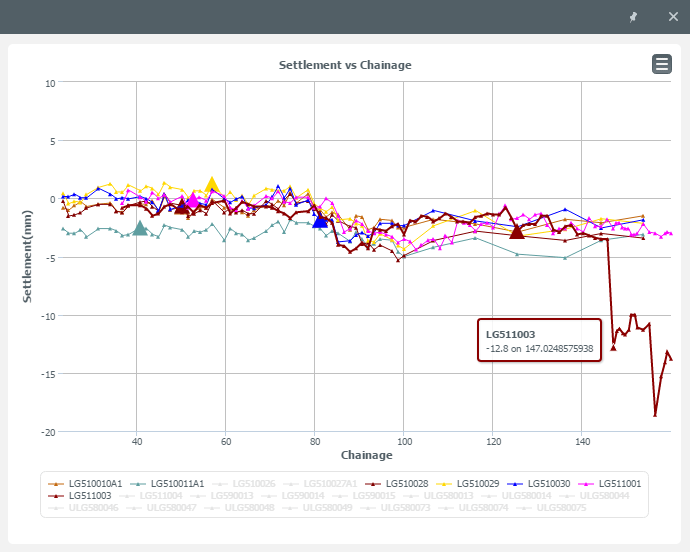
- Plots vs Time, Chainage, Proximity
- Y1 vs Y2 Show different instrument types on a common X axis scale or instrument and TBM parameters
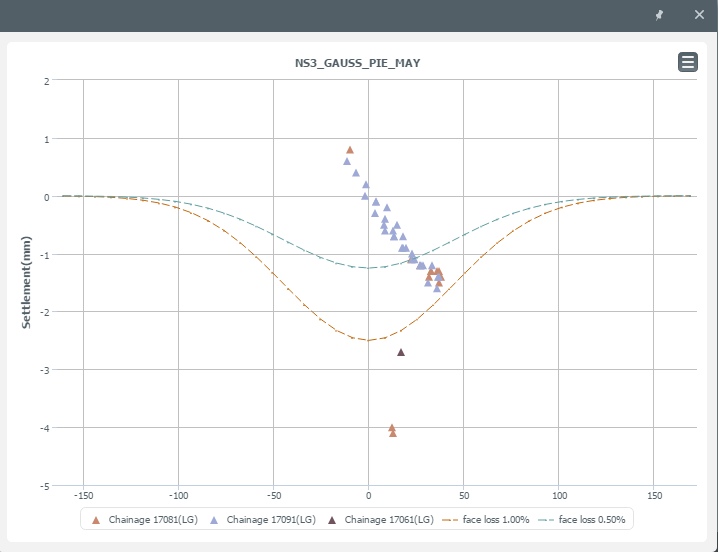
- X vs Y Plot on parameter against another eg TBM parameters or other parameter using interpolation to link
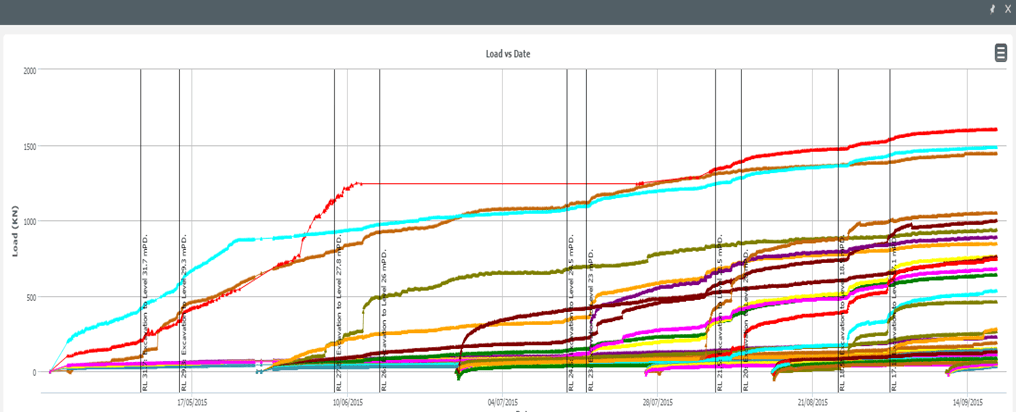
- Overplot Construction data – Show construction events which may have influenced results.
- Overplot Graphs on Drawings – Show data against plans and sections eg. Convergence
All graphs can be saved as part of the Canvas sheets library
Follow our socials!


