Articles
Maxwell GeoSystems maintain an active library of media articles and copies of its latest contributions to trade journals.
Using predictive modeling for TBM process control
ABSTRACT
Tunneling process control is the feedback between the observed behavior of the tunnel boring machine (TBM) with predictions and observations. In this paper, examples of using predictive models to improve the feedback analysis and allow the engineer to readily undertake forecasts related to productivity and ground behavior are presented. These predictive models, which can be developed for TBM parameters (e.g., face pressure), ground behavior (e.g., volume loss), maintenance strategies and construction logistics are updated/improved as the TBM progresses through the ground and the relationship between geotechnical conditions and TBM performance becomes better understood. This feedback ensures tunneling is achieved safely and effectively, while maximizing productivity and minimizing risks.
INTRODUCTION
Real time data acquisition and delivery for analysis has become standard practice in tunneling projects. This includes both TBM and instrumentation/monitoring data, providing opportunity for real time feedback analysis between construction activities and ground behavior. The real time feedback in turn provides opportunities to assess and modify predictions and expectations with respect to TBM parameters and settlement control, and aid maintenance strategies and project planning and tendering. With the advances made in both academia and industry, the understanding of the tunneling process and prediction of expected behaviors during mechanized shield tunneling has produced a number of prediction models that have been adopted and applied to design and construction planning. Furthermore, more and more data than ever before is collected during construction, which enables comparison between predictions and observations, as well as improving the predictions with the added knowledge from the data. However, due to the ongoing activities and progress of the tunnel construction, there is a need to be able to rapidly and efficiently make comparisons between predictions and observations, and even update the predictions in at least a semi-automated manner. Furthermore, this feedback analysis should be easily applied to the process control and save significant time and money on the project. This paper presents several example use cases for developing and updating predictive models for feedback analysis and process control.
PREDICTION MODELS AND PROCESS CONTROL FOR TBM PARAMETERS
As part of the construction planning, predicted (or target) TBM parameters are determined based on the anticipated ground conditions outlined in the geotechnical baseline (GBR) and data reports. However, the geological geotechnical data used for these models comes from largely spaced boreholes, often resulting in significant uncertainty in the actual ground conditions between boreholes. These target parameters include face support pressure, excavated material quantity, backfill grouting and advance speed/penetration rates. In this section, examples of such prediction models are presented as well as how feedback analysis can be implemented to improve process control.
TBM face pressure prediction
Maintaining adequate face (or confinement) pressures is essential for the face stability of the TBM to prevent unwanted ground settlement and heave during excavation, as well as to control the groundwater. Conventional practice considers a target face pressure s equal to the hydrostatic pressure u (for self-supporting ground) or, more commonly, the lateral earth pressure Kσ'v plus the hydrostatic pressure (COB 1996). A nominal safety margin (e.g., 20 kPa) is typically applied (Eq. 1). There are a number of other approaches for determining the required face support including the wedge stability model (Horn 1961; Jancsecz & Steiner, 1994; Broere 1998), the Leca/Dormieux method (Leca & Dormieux 1990) as well as numerical modeling methods (e.g., Mooney et al. 2016).
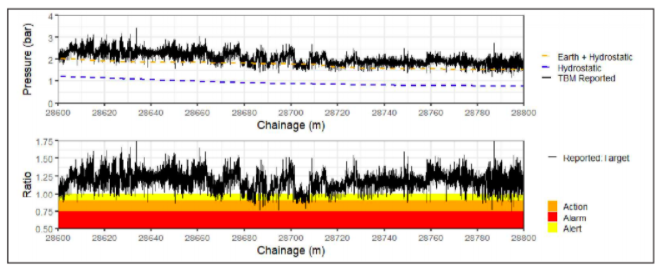
s=Kσ'v+u+20 kPaConsidering the depth of the tunnel, geological conditions and groundwater levels, target face pressures can be estimated . chainage or ring of the alignment. Figure 1(a) presents an example of target and reported face pressures (at crown) vs chainage considering the geological profile provided in the GBR and the baseline density and lateral earth pressure coefficient K values. The ratio of reported:target face pressure is presented in Figure 1(b) with example Alert, Action and Alarm levels for process control and notifying operator if adjustments to the actual face pressure are required. However, there is often a fair degree of uncertainty, particularly with respect to geology (i.e., actual K including at rest, active or passive conditions) and hydrostatic pressure (e.g., permeability, drained vs. undrained, perched water conditions).
Excavated soil/rock quantities
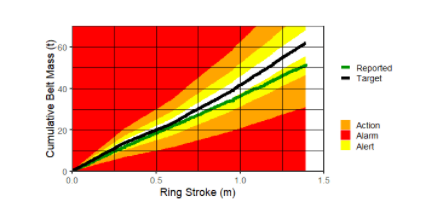
In addition to face stability, the quantity of excavated material (soil/rock/water) will have an influence on the ground deformation behavior, including settlement when over-excavation occurs and ground heave when under-excavating and soil displacement away from the TBM occurs. Earth pressure balance (EPB) TBMs are generally equipped with conveyor belt scales to measure the mass of material discharge from the screw conveyor, and laser scanners to measure the volume of material on the belt. Generally, the mass scales are considered to be more reliable and accurate in assessing the quantity of material. For Slurry TBMs, the quantity of material exiting the working chamber is measured via flow sensors in the slurry lines. The predictions for excavated mass per ring or meter of advance can be estimated by assuming the density of the soil/rock excavated and the excavation (cutterhead) area. However, this actual density of the ground being excavated is often uncertain, particularly when excavating high variable deposits such as alluvium and glacial till where the density can vary spatially. In addition, the target excavated mass will change dynamically with the inclusion of injection fluids such as slurry, foam, polymer and water into the excavation chamber and screw conveyor (if EPB). Figure 2 presents an example actual vs target excavated mass for one ring from an EPB TBM. Note, the target mass changes dynamically to account for the injection of conditioning fluid. Representative Alert, Action and Alarm levels are presented as a form of process control to alert the TBM operator if adjustments are needed.
Backfill grouting
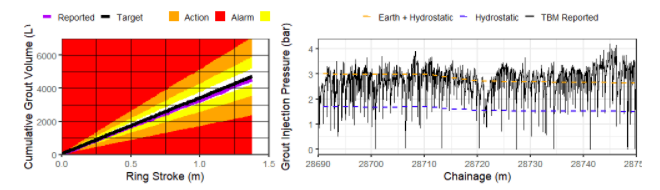
The quantity of required backfill grout is generally related to the geometry of the TBM considering the volume of the shield gap between the cutterhead and end of the tail shield. However, the injection pressure of the backfill grout is also significant as it must overcome the in-situ pressures of the ground around the TBM to properly fill the shield gap (Grasmick et al., 2015). Since the maximum pressure around the shield occurs at the crown as the vertical effective stress, the minimum target grout backfill pressure should be equivalent or greater than this stress (Eq. 2). Figure 3(a) presents an example of actual vs. target backfill grout injection volume for one ring and Figure 3(b) presents the actual vs. target backfill injection pressure for a 60 m section of a tunnel drive. As with the face support and excavated material quantity, Target, Alert, Action and Alarm levels for both backfill volume and pressure are also presented for process control purposes.
Feedback loop for improved predictions and settlement control
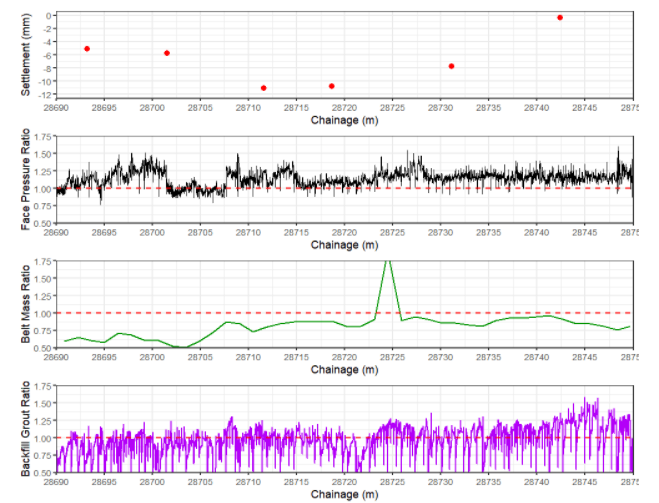
To assess if predicted/target TBM parameters are adequate, one must examine the ground response (e.g., deformation and groundwater pressure) observed from instrumentation and monitoring data in parallel with the reported TBM parameters. For the purpose of settlement control, one can assess the ratio between reported and target face pressure, excavated mass, and backfill grout. One can consider the predicted target TBM parameters to be adequate if ground settlement is negligible and does not approach alert/action/alarm (AAA) levels and (a) reported face pressure is greater or equal to target, (b) reported excavated mass is less than or equal to target and (c) reported grout injection volume and/or pressure is less than or equal to target. However, if ground settlement exceeds expected levels while rules a-c are met, then one or multiple predicted target TBM parameters are considered to be inadequate and should be modified. Lastly, if settlement is negligible while one or more of the rules a-c are not met, then the predicted targets are considered adequate, but could potentially be modified to improve overall efficiency. Figure 4 presents an example of this type of assessment for a 60 m (40 rings) section of a tunnel. The geological condition (Alluvial soils) is considered to be the same over this 60 m section. Between chainage 28710-28720 m, there are two surface settlement monitoring points that exhibit significant settlement, with final settlement magnitudes exceeding the Alert level of 10 mm. Examination of the face pressure ratio reveals that the reported face pressure was less than the predicted target pressure for ~8 m between chainage 28700-28710 m. However, the face pressure quickly recovers and exceeds the target pressure. Examination of the backfill grout injection pressure ratio reveals that the reported pressure was below the predicted target for ~5 m around chainage 28720 m. Therefore, it can be inferred that the target TBM parameters are generally adequate, and the lack of process control to maintain these targets during TBM operation resulted in unwanted settlements.
Advance speed
Predicted advance rates highly depend on the geological and geomechanical properties of the ground being excavated. Previous experience and knowledge gained during construction can help with establishing reasonable predictive targets. However, it should also be recognized that other influences related to TBM operation parameters will also have an influence, including thrust force, cutterhead rotation speed, chamber pressure and cutter tool wear. Recent research has advanced the prediction of advance rate performance incorporating all influences using machine learning techniques (Mokhtari & Mooney 2019, Grasmick et al. 2020). Figure 5 presents some example results of a prediction model compared to reported advance rates and reveal promising results. This analysis approach can also be used to identify optimum key TBM operation parameters to achieve the highest feasible advance rate.
PREDICTION MODELS AND PROCESS CONTROL FOR SETTLEMENT
The ground deformation behavior in response to tunneling activities is one of the most significant factors influencing the prediction of target TBM parameters, particularly in urban settings where allowable ground deformation is minimal. With real-time and frequent monitoring of the ground settlement, specifically when the TBM is near the monitoring point, there is opportunity to compare the predicted vs. observed deformation behavior well before magnitudes approach AAA levels and make adjustments to the TBM parameters if required. In this sense, the predicted development of the ground settlement with respect to the TBM position relative to the monitoring point serves as a dynamic Alert level. In classical greenfield settlement analysis, the settlement progression as the TBM approaches a monitoring plane is assumed to take a Gaussian form (ITA 2006). The magnitude of settlement vs. the relative position of the TBM can be estimated by a cumulative probability density curve (Eq. 2):
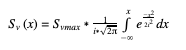
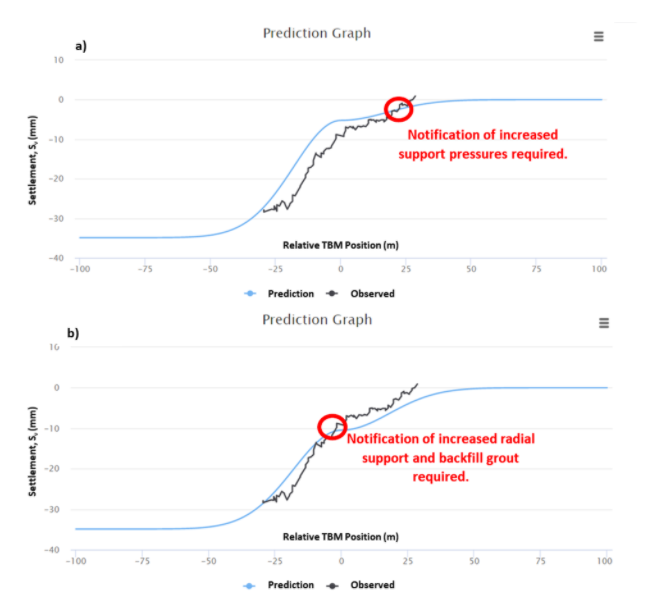
where x is the distance between the monitoring plane and the face of the TBM, Svx is the surface settlement when TBM is at x, Svmax is the maximum surface settlement and i is the inflection point that defines the shape of the settlement profile. Numerical modeling methods can also be used to develop the longitudinal settlement predictions. Figure 6a shows a predicted longitudinal settlement curve with the observed settlement behavior for a ground surface monitoring point. It can be observed that the observed settlement exceeds the prediction 20 m in front of the TBM. This indicates that the face pressure is not adequate and should be increased, along with increasing radial shield support and backfill grout injection to minimize final settlements. Figure 6b shows a case where the face pressure is adequate, but the observed settlement exceeds the prediction above the TBM shield. This serves to notify the TBM operator that radial shield support and backfill grout injection should be increased to minimize final settlements.
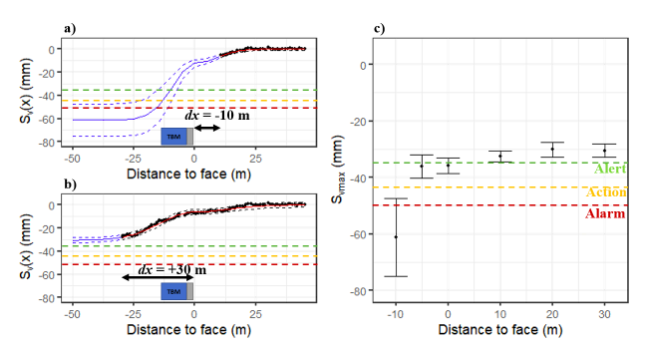
One can also use early ground deformation readings in front of the TBM to predict final settlements using nonlinear regression and analytical models for longitudinal settlement. Nonlinear regression is performed by determining the nonlinear least squares (nls) of the settlement trough equation parameters Svmax and i (Eq. 2) fitted to actual data. The output of this regression analysis is the estimated parameters, Svmax and i, and their associated standard error. The associated uncertainty is then propagated via second-order Taylor expansion and Monte Carlo simulation to calculate prediction intervals for distances not yet measured. Figure 7 presents the results of the nls regression analysis for TBM positions between -10 and +30 meters from the monitoring plane. Figure 7 (a) and (b) show the results for dx = -10 and +30 m, respectively. Here, the Eq. 2 (red line) is fitted to the observed data (black points). This best fit line is extended to dx = +50 m (distance to face = -50 m) as represented by the solid blue line. The propagated error in the fitted equation is represented by the dashed blue lines. Figure 7 (c) summarizes the predicted and 95% probability interval of Svmax for each dx analyzed. While the uncertainty in predicted Svmax is high (±15 mm) when the TBM face is -10 m from the monitoring plane, the uncertainty is significantly reduced at dx = -5 m. This implies that the magnitude of final settlement can be estimated to a degree of confidence within ±5 mm prior to the TBM face passing the monitoring plane. Knowing this, the operator can take action if needed to apply mitigation such as adjusting support pressures and tail void grouting to minimize further settlement and attempt to prevent settlement exceeding action/alarm/alert levels. The outcomes of this analysis can also be used to update predictions well ahead of the TBM face.
PREDICTION MODELS FOR MAINTENANCE STRATEGIES And CONSTRUCTION LOGISTICS & PERFORMANCE
While predictive models are more commonly applied to TBM parameters and ground behavior, they are also applicable to other aspects of tunnel construction including maintenance strategies, construction logistics and overall construction performance. In fact, predictive models for process control related to these aspects are extremely valuable as they contribute more to time related factors, which translates to significant costs/savings. However, developing these predictive models are not as straightforward, particularly due to the lesser degree of information recorded, compared to TBM parameters and ground behavior. This raises the need for better digitization of such data including intervention records, maintenance strategies, supply inventories and delivery, and shift reporting. This section discusses some practical approaches to developing and applying predictive models for these aspects.
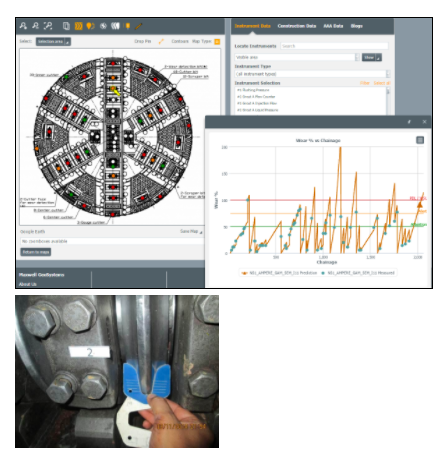
Maintenance strategies
There are numerous models for predicting the rate of cutter tool wear considering different ground types, cutterhead configurations and cutter tool types. These models generally aid in the preliminary planning for interventions. However, after the first intervention, the predictive models for cutter tool wear should be updated to optimize the next interventions and tool replacements, rather than relying on the initial model. One such approach to this is normalizing cutter tool wear against chainage to predict future wear rate and setting targets for when the tools will require replacement (Figure 8). In addition, mapping the observed and predicted wear over the entire cutterhead provides information to the degree of uniform vs. non-uniform wear over the entire cutterhead.
In addition to cutter tool maintenance, project data can be used to guide other maintenance strategies such as cutterhead cleaning, rehabilitating parts, etc. Examination of machine performance vs. breakdown information for the current and past projects can aid in identifying the most effective strategies. For example, pushing the TBM hard to go faster but requiring more maintenance, or going less hard and requiring fewer maintenance interventions. Another example is requiring regular, scheduled maintenance and interventions to prevent any unexpected breakdown (proactive approach) vs. only performing interventions and maintenance when issues arise (reactive approach). These strategies all come with benefits and drawbacks, and will often be influenced by the machine type and ground conditions. Performing a calculated approach to identify the best approach using historical and current project data can potentially provide significant time savings.
Construction logistics and performance
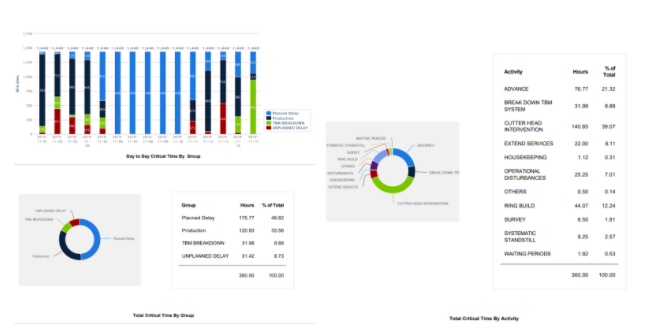
Data obtained with respect to construction logistics and performance can also be used to develop and improve prediction models with respect to overall construction progress. Examples of such data include supply/waiting time lost (e.g., segment delivery for ring build) and day vs. night shift performance. Examining such data provides realistic expectations of the overall construction progress and aid in scheduling. Furthermore, this data can be used to optimize logistics to minimize downtime. Figure 9 shows an example of examining the different construction related activities and their contribution to the overall construction progress time.
BIG DATA BENEFITS TO PROJECT PLANNING AND TENDERING
With the accumulation of big data from tunneling projects today, there is a vast library of information and data that can be harvested to improve our understanding of related influences during tunneling and improve overall process control and efficiency. However, a common challenge often faced is the data is not stored in a common data model or format to make future use straightforward. While standardization has made progress for certain types of data such as the Association of Geotechnical & Geoenvironmental Specialist (AGS) format for site investigation, laboratory testing and monitoring data, there remains a need for further standardization of data within the global tunneling community. While vast quantities of TBM data are routinely collected from tunneling projects, they are generally not qualified by influences such as ground conditions, environment, constraints, groundwater, etc. in real time. Currently, significant post-processing is generally required to categorize the TBM data by influences in order to effectively gain knowledge that can improve the construction process. However, with proper design and implementation of database systems containing all data related to the project (TBM, geotechnical, construction activities), this qualification of the data can be done in real time and generally autonomous manner. There are number of benefits to efficiently organizing data collected during tunneling projects including project planning and tendering. As one case example, data from previous projects were used to forecast 80% of a future tunneling project in Hong Kong and proved to be highly accurate (J. Endicott, personal communication, 2013). This aids both the owner and contractor in the project planning and tendering process including risk assessment, scheduling and budgets.
CONCLUSION
Predictive models serve as valuable resources for tunneling projects, from the project planning and tender phase all the way through the completed construction. With the vast amount of data collected during the projects including site investigation, TBM and other machine parameters and the ground behavior in response to construction activities, our understanding of how the TBM and ground interact together during construction continues to improve both from one project to the next and during active projects. This provides a wealth of information to perform feedback analysis and continually improve these predictive models and optimize TBM process control to minimize risks and achieve maximum production. Furthermore, data collected relating to interventions, maintenance, material delivery and supply, and shift activities provides valuable insight into the overall construction process. This information can be used to easily identify critical activities that are contributing to the overall production rate, as well as optimal intervention and maintenance strategies. These opportunities raise the need for efficient and standardized methods for developing these models in addition to using feedback analysis to improve the predictions during construction in real time. This includes identifying best strategies for selecting and obtaining data for the prediction models, including geotechnical and geological modeling, calculating critical parameters in real time to update the prediction models, and updating models using as-encountered information. Furthermore, this requires efficient and well-designed data management systems that are capable of handling all of the data and rapidly performing calculations to update models in real time so the engineer can make informed decisions quickly.
REFERENCES
- COB Commissie L510 (1996). Inventarisatie ontwerpmethoden boortunnels voor weg- en railverbindingen. Technical Report L510-01, COB.
- Grasmick, J.G., Mooney, M.A., Rysdahl, B., Prantil, E., & Thompson, A. (2015). “Evaluation of slurry TBM design support pressures using East Side Access Queens Bored Tunnel data.” Rapid Excavation and Tunneling Conference 2015, New Orleans, June 7-10, 2015.
- Grasmick, J.G., Yu, H., Maxwell, A., Mooney, M.A., Ng, H.W., Klados, G., Trevisin, P. (2020). “Tunnel process control for Klang Valley Metro Phase 2 using machine learning and artificial intelligence.” ITA-AITES World Tunnel Congress, WTC2020 and 46th General Assembly. Kuala Lumpur, Malaysia 15-21 May 2020.
- Horn, N. (1961) “Horizontaler Erddruck auf senkrechte Abschlussflächen von Tunnelröhren.” In Landeskonferenz der Ungarischen Tiefbauindustrie, pp. 7–16.
- Jancsecz, S. and Steiner, W. (1994) “Face support for a large mix-shield in heterogeneous ground conditions.” Tunneling ’94. London, Institution of Mining and Metallurgy.
- Mokhtari, S. and Mooney, M.A., Predicting EPBM Advance Rate Performance using Support Vector Regression Modeling, Tunnelling and Underground Space Technology, 2019, in review.
- Mooney, M.A., Grasmick, J.G., Kenneally, B. & Yong, F. (2016). “The role of slurry TBM parameters on ground deformation: Field results and computational modeling.” Tunnelling and Underground Space Technology, 57(8), 257-264.
The paper “Using Predictive Modeling for TBM Process Control” by Dr.Jacob Grasmick and Dr.Angus Maxwell provides examples of using prediction models to improve feedback analysis and allow the engineer to readily undertake forecasts related to productivity and ground behaviour.
