Interferometry Synthetic Aperture Radar (InSAR)
The Data
Maxwell GeoSystems (MGS) have access to a number of satellite resources to undertake satellite interferometric radar processing and present these results in MissionOS. These satellites include the “free” European Space Agency Sentinel data (below) and commercial satellites such as TerrasarTX and Cosmo Skymed which we have used since 2008. We have a history of successful delivery of InSAR monitoring through our own processing and delivery through to the absorption and presenting data provided by others. Projects include Melbourne Metro, HS2, LA Metro and Hong Kong tunnels.
Processing
MGS provide data processing using a number of independent processing labs at a variety of price points depending on the turn round time requested. At worst this is a few days to at best within 24 hours.
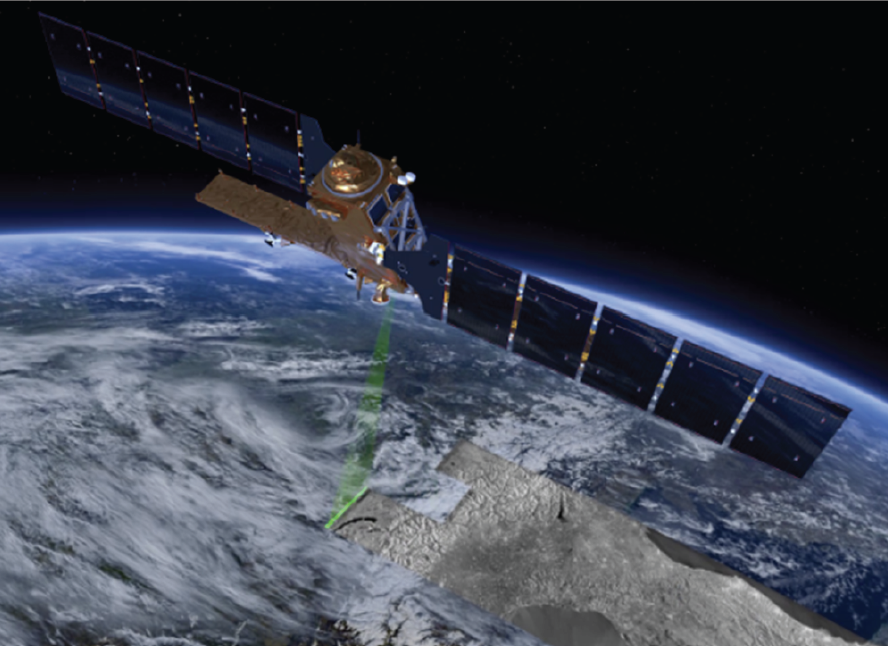
A variety of satellite data is available both free & commercially (free ESA Sentinel X shown)
To process InSAR data we assemble a “stack” of historical imagery and process this to increase signal to noise ratio, remove atmospheric effects and to account for topography. Note that even the lowest cost processing produces usable monitoring data with accuracies of +/T2mm as is evidence by comparing long term InSAR data with manual survey Fig 1).
Results can be improved more by:
- Using higher spatial resolution data sources
- Increasing the stack size
- Providing terrain control (eg a digital terrain model)
- Installing corner reflectors with known coordinates
A variety of satellite data is available both free & commercially (free ESA Sentinel X shown)
Data Management
Each SAR scene can represent more than half a million data points. This is not best represented on the system as discrete data points and the data is first converted to image format and overlain on the display with a colour rendering to represent the movement over the period of measurement.
InSAR image rendering in MissionOS
Loading Data to MissionOS
Data is loaded to MissionOS using backend processes which convert the numerical data to GIS overlays for efficient interactive display. These same processes automatically extract time series data and insert this into MissionOS for use as conventional monitoring points.
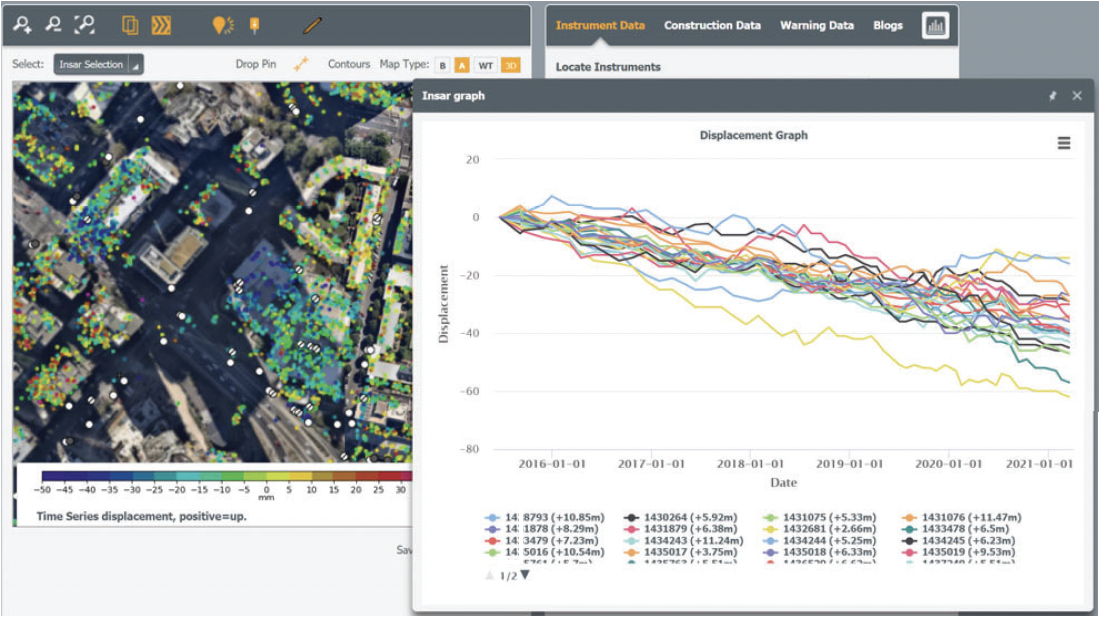
Viewing InSAR data in MissionOS
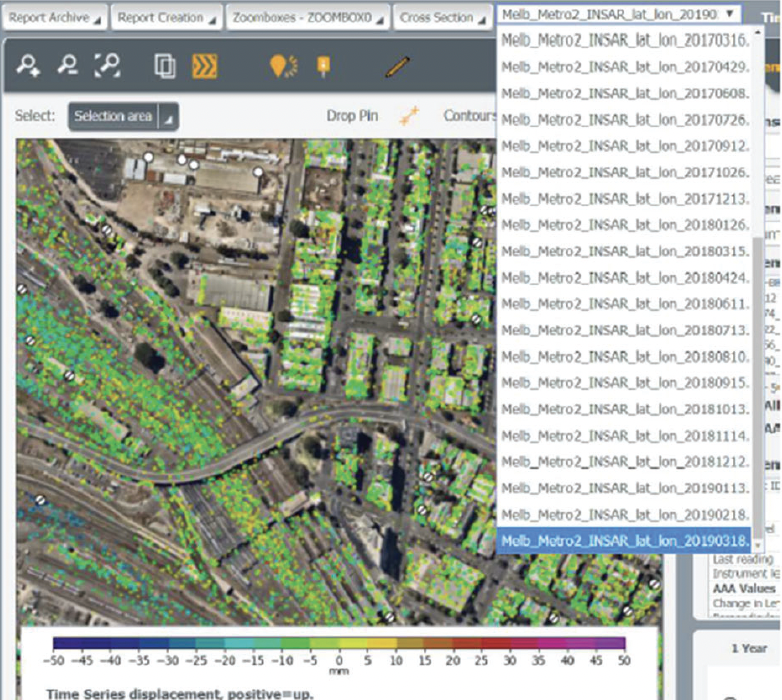
InSAR scenes are available from the InSAR drop down list. This will overlay the appropriate image and the user can then zoom to particular study areas. The data can also be viewed in 3D and combined with 3D buildings and google earth if desired.

InSAR scenes can be viewed on the map with other project information & in 3D
Time Series Data Extraction
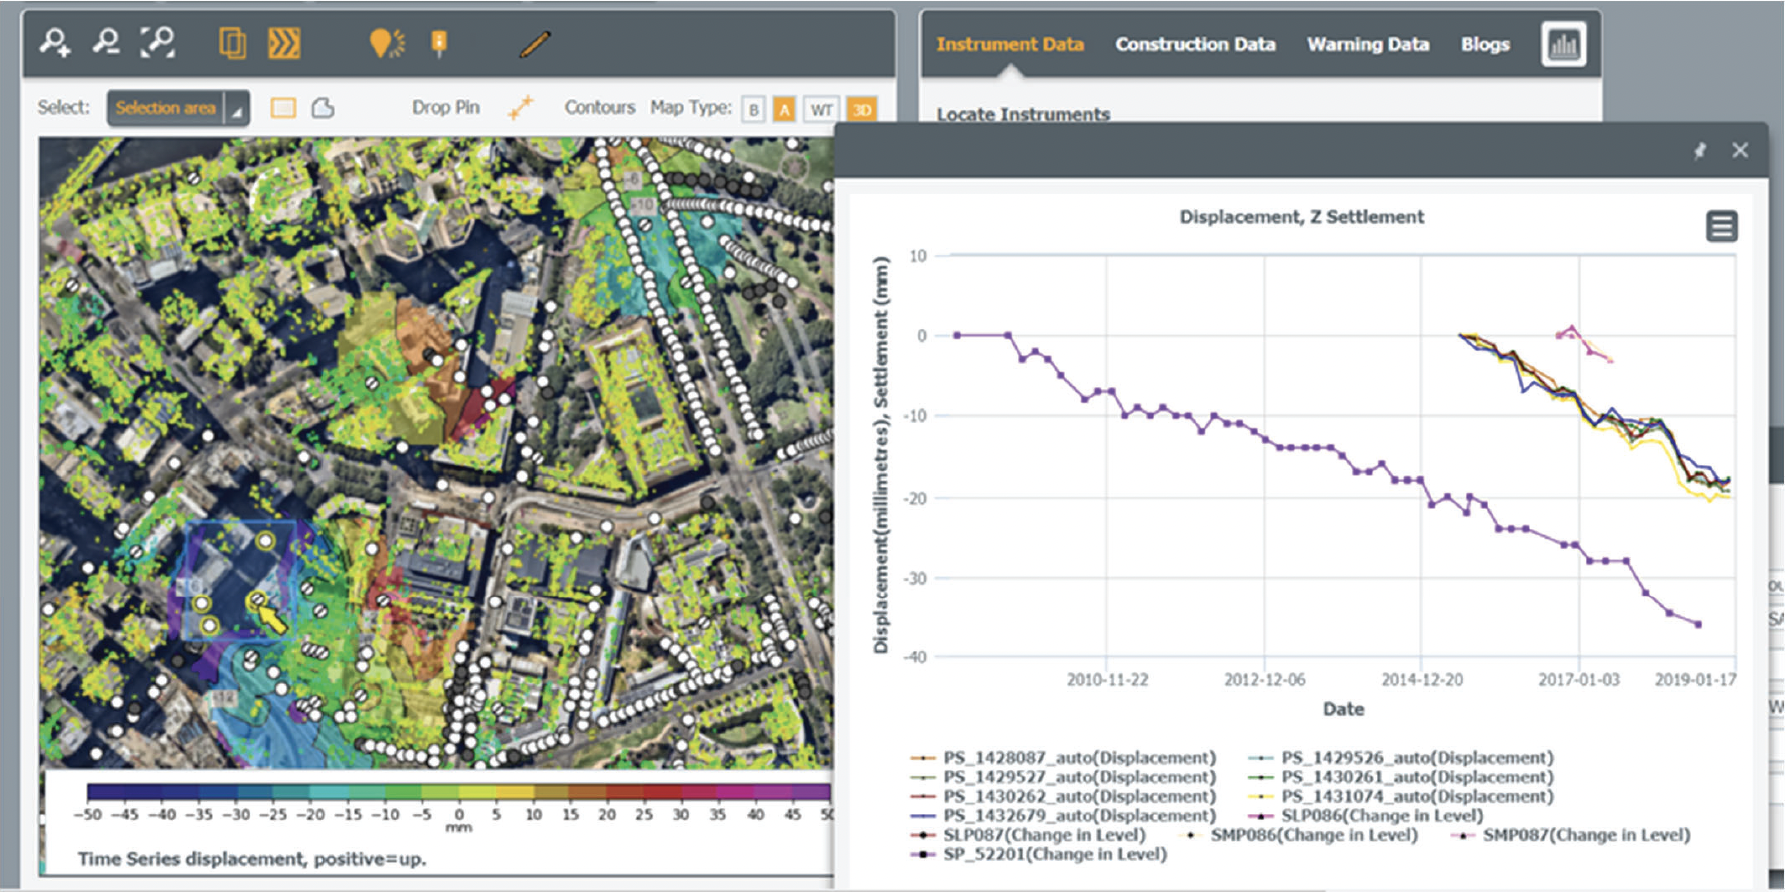
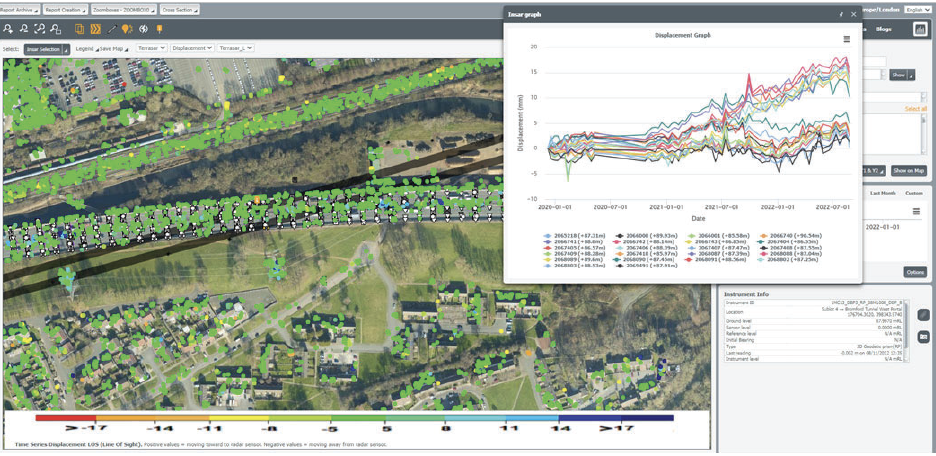
Processed data will include time series data for points exhibiting a correlation. From this subset of the possible scatterers the admin user can manually select points to extract the time series and save as a ‘pseudo’ instrument. These time series can then be included in graphs for comparison with physical survey instruments, section, contours and 3D representations. Calculations can also be applied to this data such as moving average and rate of change. MissionOS is well suited to take processed InSAR data for direct comparison to physical instruments and construction activities. MGS have integrated InSAR into MissionOS on several projects. This is displayed as discrete points or images colour coded by movement.
Time series for individual points can be manually selected from the map interface & saved
Contours and Sections
With reliable time series data identified the data can be used in contours and sections in the same way as with any other settlement data. This can include data model calculations to correct for incidence angle or separation of oblique movements into lateral and vertical components.
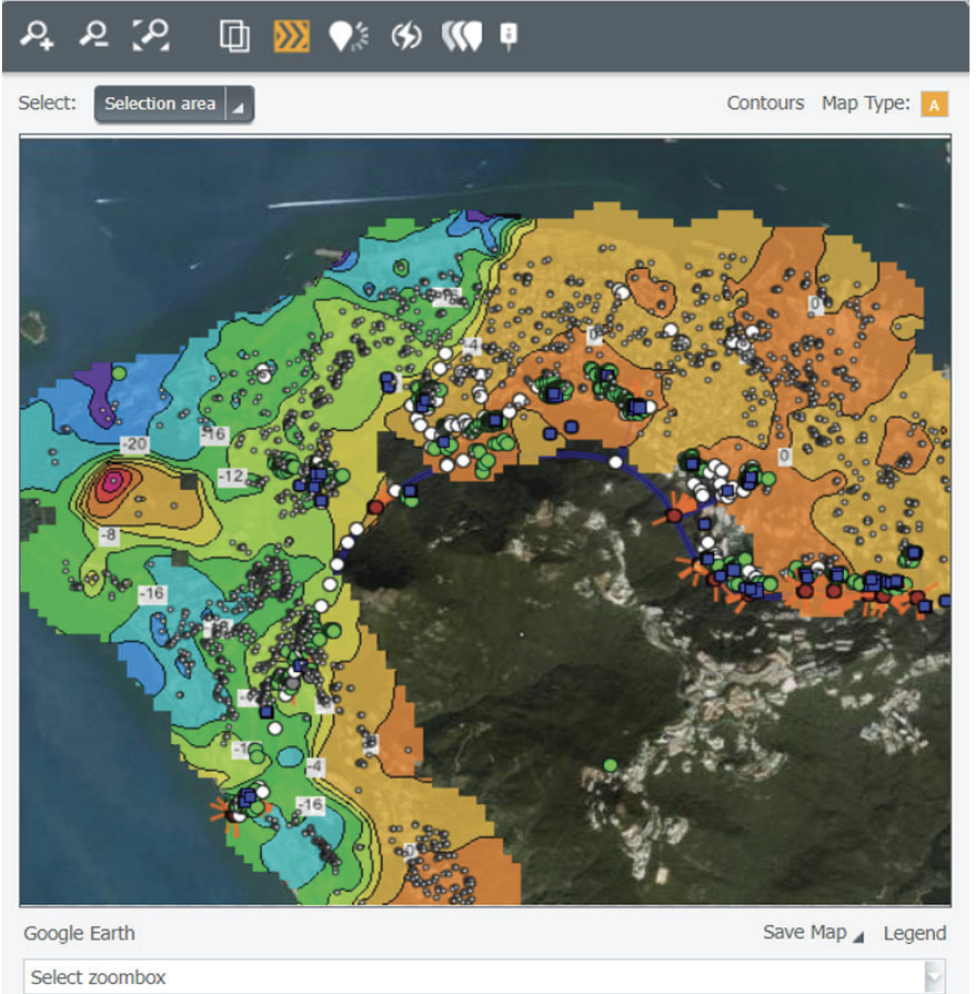
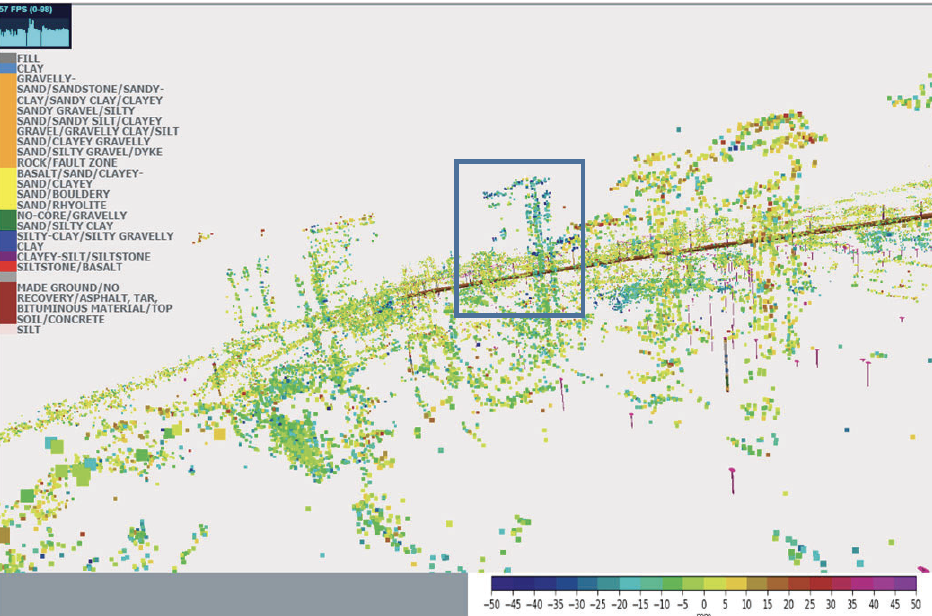
Contours of Ground Movement on Hong Kong Island. The boundary between relatively stable granitic soils & volcanic soils prone to landslip can be clearly seen
Comparison with Measured Survey Data
Figure 1 shows plot of settlements gleaned from selected timeseries InSAR data plotted along with actual settlement results. Rates of movement are comparable to observed physical measurements. In addition, InSAR and physical monitoring points can be coupled to better isolate construction induced and natural ground deformation behaviour using Derived Instruments. For example, if a consistent historical rate of change is evident in the INSAR data, this can be subtracted from the physical monitoring data. Moving average functions can also be applied to account for time lapses between satellite passes.
Can InSAR replace Manual Monitoring?
The shortest return period for satellites is now of the order of 710 days which means that it can be used for post construction monitoring which is commonly weekly. This manual monitoring is often uneconomic since the small number of monitoring points to be measured require long traverses with many unpaid intermediate points. To use InSAR in place of manual monitoring on Melbourne Metro we successfully demonstrated the equivalence of InSAR versus the manual records. As can be seen from Figure 1 even the basic processing chain provides comparable results. With this established we can extend to the works by identifying the usable “good” points in the data set.
Separate ground points from building points
But what makes a “good” InSAR point and how can we find them amongst the millions of raw points. If we want ground points then we can filter based on height compared to a digital elevation model (DEM) and position outside building footprints.
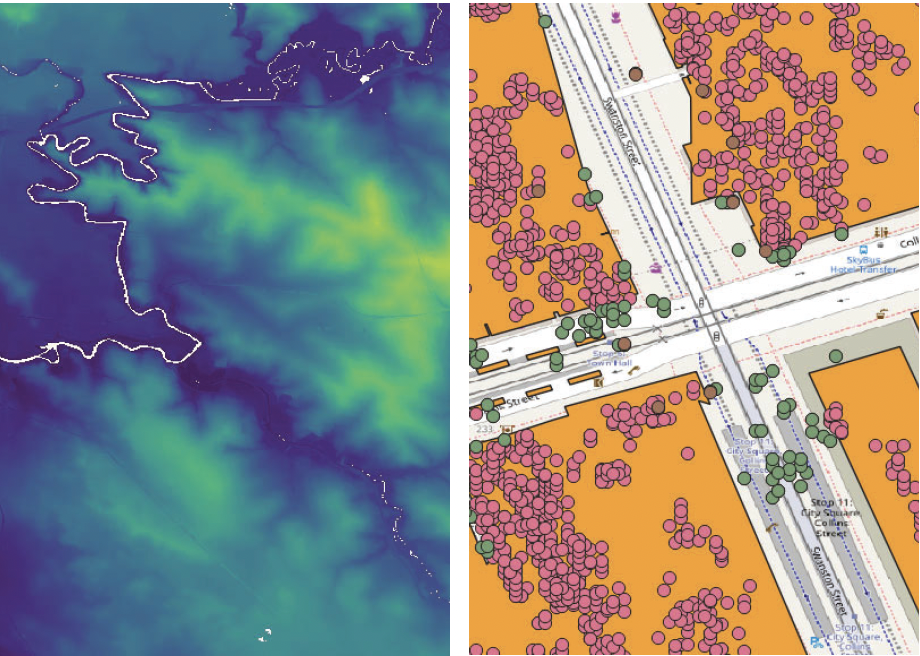
Filter ground points by height relative to DEM & position outside building footprints
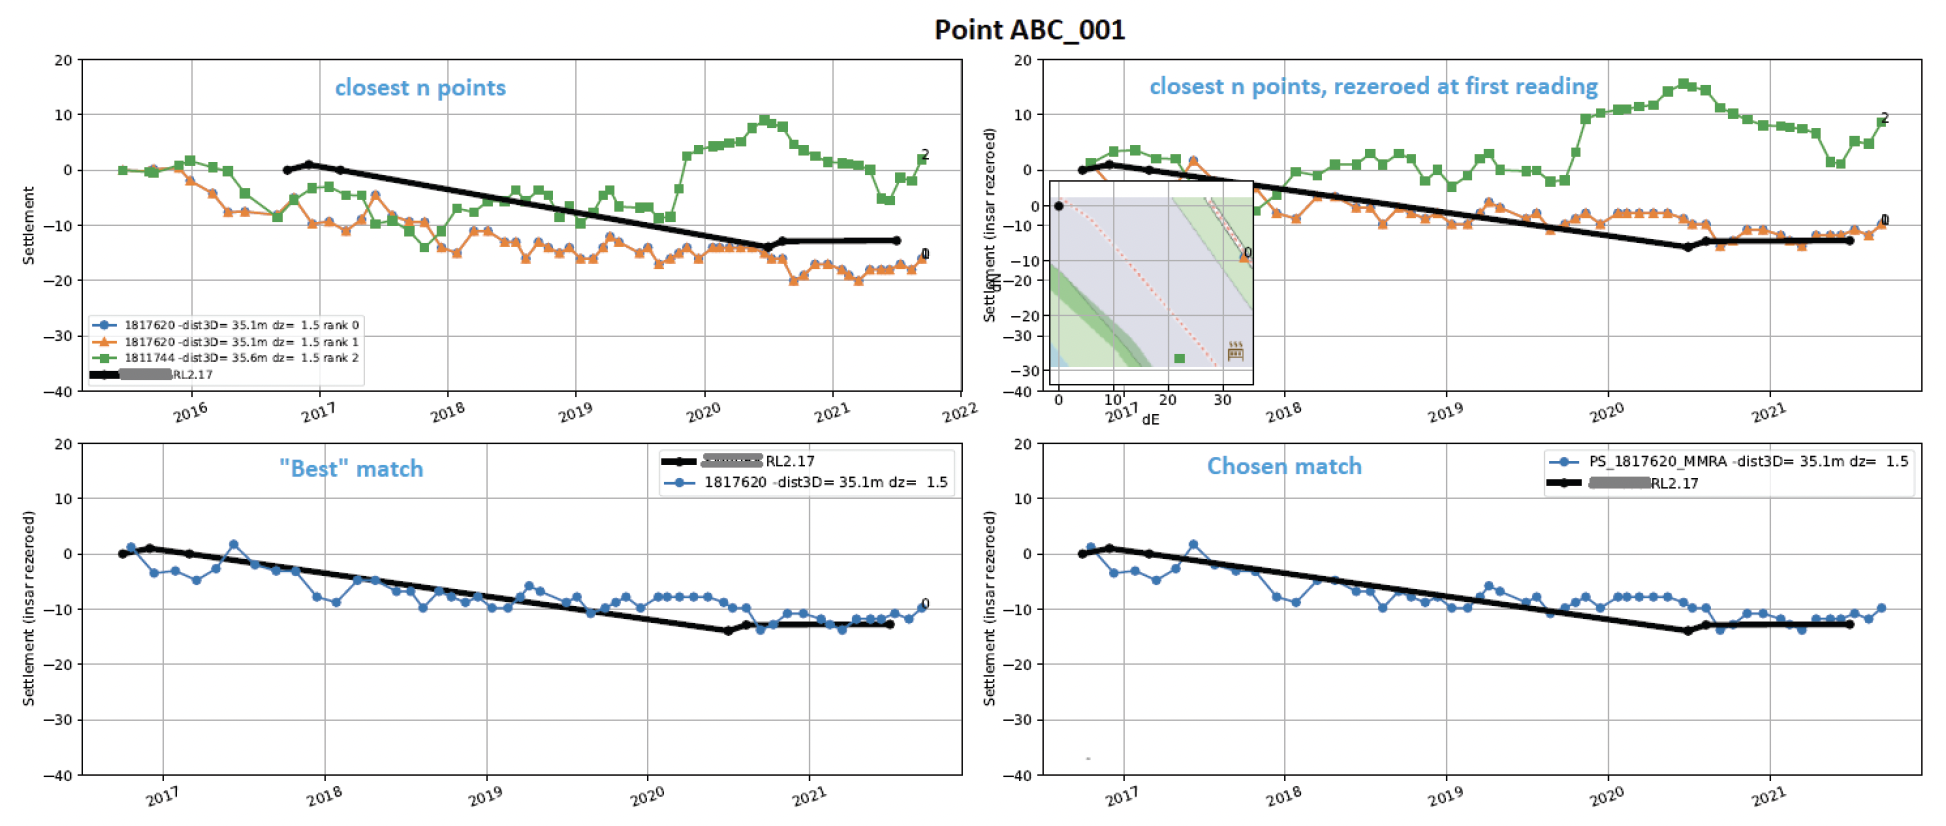
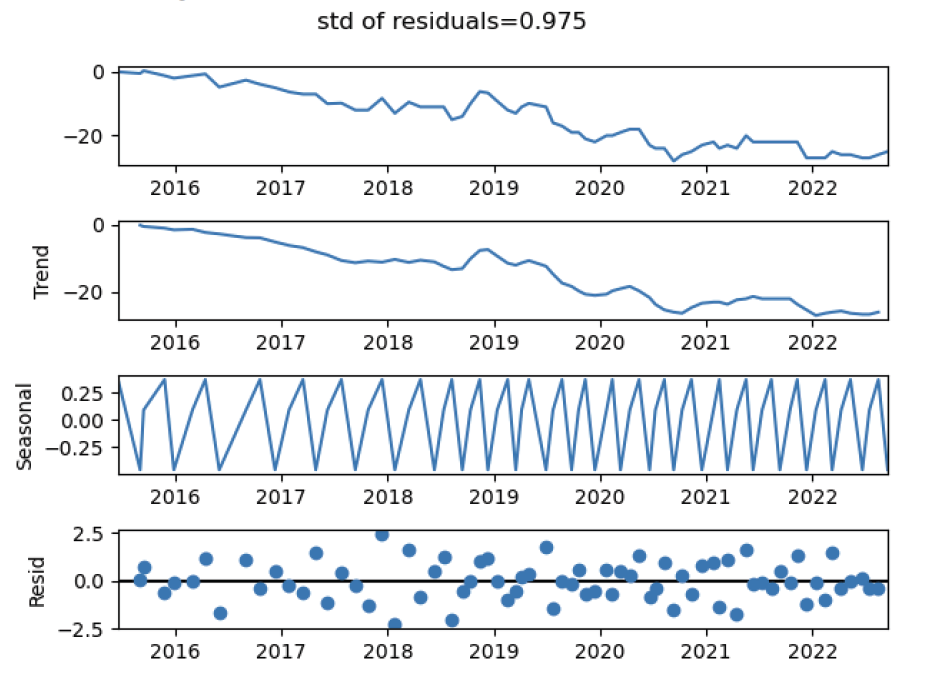
Raw survey Vs Raw in InSAR (top left); Raw survey Vs Rezeroed InSAR (top right); Best match according to lowest sum of square of residuals (bottom left); Manually chosen best match (bottom right)
Auto find “good” InSAR points across the project
Manually finding “good” InSAR points is fine for specific areas of interest but to it across the entire project is very time consuming. MGS can auto identify good points. We...
- Partition the data into tiles across the project footprint.
- Decompose each InSAR point time series into trend and noise
- Within each tile assess the best n points by the lowest standard deviation of the noise (i.e. least jagged time series)
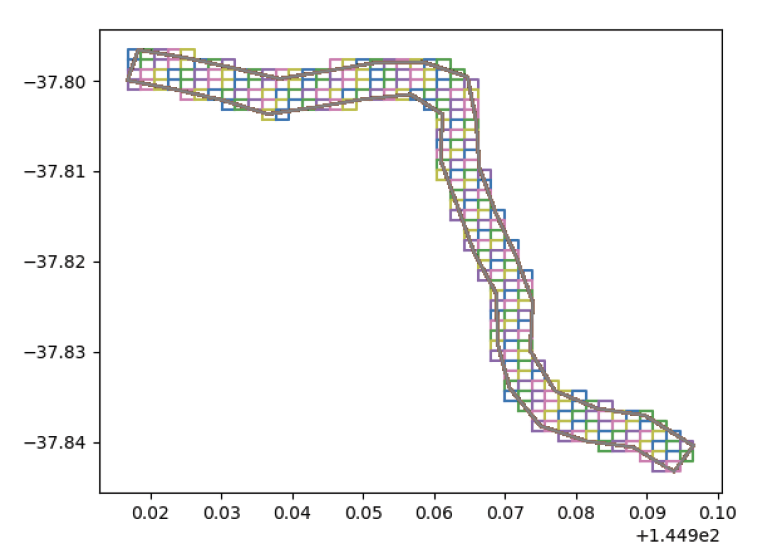
Alignments broken into tiles
Find InSAR points that best match traditional survey, and can replace them for long-term monitoring
InSAR compliments traditional survey. Once the survey time series are established, MGS can identify InSAR points that best match the survey data potentially replacing the survey instruments for long term monitoring.
For a particular survey point the time series of the closest 3 to 20 InSAR points are rezeroed at survey start time. The differences (interpolated) between the InSAR time series and the survey time series are squared and summed. The best match has the smallest summation.
Applications
As can be seen from the examples InSAR has particular relevance to tunnelling works and specifically for the assessment of ground movements. The success of this depends on the signal to noise ratio in the area of interest. This is governed by the permittivity contrast of the material (with air) and the availability of internal reflections to bounce energy back. Earth, bitumen and concrete have relatively low values and therefore need quiet environments in order to get good results. For this reason most backscattering in urban environments comes from the buildings. These characteristics mean that buildings are ideal for monitoring with InSAR. Note for best results the InSAR should be oblique.
Identifications of building with permanent settlement trends using oblique InSAR
Longitudinal assets such as bridges and viaducts are also suitable and a lot of data can be absorbed from one survey.
Differential movements across a joint in a viaduct
Mining
InSAR is also commonly being used for monitoring of mining infrastructure particularly tailing dams where access for monitoring is difficult and an overall view of the dam slopes is needed.
Not just movement monitoring
An additional biproduct of the InSAR is an indirect measure of ground saturation. Since water has a higher relative permittivity (80) than clay soils (30) variations in the back scattered energy can give indications of more saturated zones within the embankment material.
