Articles
Maxwell GeoSystems maintain an active library of media articles and copies of its latest contributions to trade journals.
Detecting Adverse Rock Condition ahead of Tunnels by Interpreting Jumbo Percussion Drill Logs
Most often geological site investigation for tunneling projects does not include directional cored bore holes covering the whole future tunnel alignment. In that case a need arises to test the rock mass condition ahead of the tunnel by short probes together with tunnel advance. In Hong Kong tunneling practice this need is recognized particularly in case of undersea tunnels and specified by the Client in conditions of contract. However, the understanding of probing ahead is limited to visual logging of color of flush, grade of chippings and penetration rate with the use of stop watch by the geologist during percussion drilling. Visual logging proved to be efficient and accurate in detecting extreme rock mass condition e.g. completely decomposed rock. Yet from the other hand it appeared to create a significant safety hazards for the logging geologist who works close to maneuvering booms and rotating string at noise level from hammers above 150 dB. In such hard working condition the quality of the records can also be affected. It is presented in this paper an interpretation of Jumbo percussion probing to detect adverse rock mass condition ahead of the tunnels as an alternative to visual logging.
1. Introduction
Analysis was carried out on data recorded by AMV Jumbo two boom machine: P — penetration rate (m/min), HP — hammer pressure (bar), FP — feed pressure (bar) and RP — rotation pressure (bar). Selected cases were used to test the developed data processing algorithm in addition to the automated interpretation provided by Bever Control software. The results of the tested algorithm show the adverse rock condition can be inferred from the percussion drill logs with confidence, hence the presence of the geologist at the face when drilling could be eliminated. A significant advantage of this system was the ability to interpret not just probe holes but also the drill holes belonging to regular grouting rounds. As such, probing on HATS2A was undertaken as part of regular grouting works and did not cause any additional delay to the production cycle. The statistical interpretation methodology was largely based on works by Schunnesson (1997). In his approach the penetration and rotation pressure can be assumed as dependable variables while the rock resistance, hammer pressure and feed pressure as well as drill string length are the independent variables. By removing hammer, feed and length effect on penetration rate the remaining variations can be inferred to correspond to changes of rock resistance.
2. Algorithm Of Interpretation And Comments
2.1 Combining a representative sample (Combined Sample - CS) from selection of probe logs
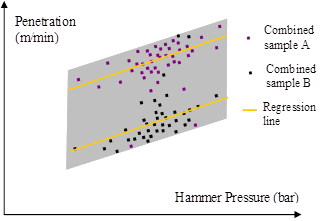
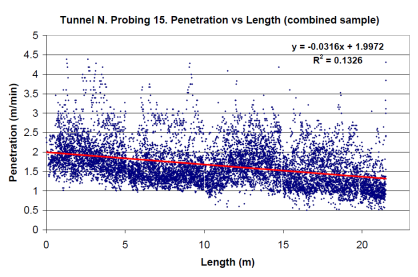
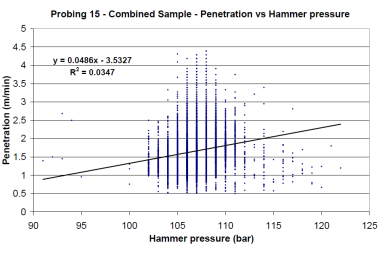
The sample that will provide a reference during further processing needs to include a representative of all expected Penetration PR hence the probes have to intersect all possible weathering grades, intensity of fracturing and rock lithological types. These extreme rates do not need to appear in the Combined Sample in large numbers yet they need to be present e.g. a thin seam of completely decomposed rock within predominantly fresh to highly weathered granite provides full range of penetration rate in the sample. In that sense completeness of the Combined Sample can be verified by geological mapping of the tunnel section from which the probes were selected. Practically it may not be possible to assemble a sample without a histogram bias towards higher or lower penetration rates. This effect can be mitigated when processing the data. Typical distribution of pairs (PR vs HP) in the Combined Sample is presented on the Fig.1A and Fig.1B.
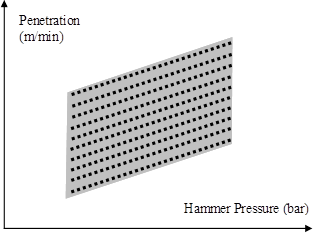
Each string of dots on Fig. 1A represents P vs HP dependency when drilling through uniform material of particular strength. The highest string of dots represents the strongest material while the lowest string of dots represents the weakest material. The Combined Samples A and B on Fig. 1B are limited to a small “clouds” of all possible readings demarcated as grey area. Both include points corresponding to the weakest and the strongest material yet each shows significant bias of the distribution of P values, A towards the weaker material, B towards the stronger material.
2.2 Filtering out the readings related to factors other than drilling (e.g. changing rod)
Filter criteria are determined by analysis of graphic presentation: Penetration P, Hammer Pressure HP and Feed Pressure FP versus probe hole length L of all probes included in the Combined Sample. The selection of filter minimum and maximum threshold values can be also aided by analysis of histograms of P, HP and FP. Filtering criteria are used as an input to Excel custom filter option and applied both to combined sample and particular probe log being investigated.
Filter criteria are determined by analysis of graphic presentation: Penetration P, Hammer Pressure HP and Feed Pressure FP versus probe hole length L of all probes included in the Combined Sample. The selection of filter minimum and maximum threshold values can be also aided by analysis of histograms of P, HP and FP. Filtering criteria are used as an input to Excel custom filter option and applied both to combined sample and particular probe log being investigated.
2.3 Correcting The Combined Sample And Probes Logs Of Length Effect
Filtered data of the Combined Sample is used to obtain regression equation representing dependency between penetration and probe length. This dependency is machinery specific and is well researched. It is related to increasing weight of the drilling string and increasing friction area between the string and the probe hole wall. The linear regression represents the best fit for the effect of drill string length on Penetration Rate. The coefficient of determination R2 is low and generally irrelevant due to large variation of the Penetration related to other than length factors. The factors obtained from Combined Sample linear regression are used to correct the data of the string length effect both in the Combined Sample and in the particular probe log being investigated. The correction is independent to the intercept of the linear regression, hence there is no distortion of the data related to Combined Sample not covering uniformly the different rock condition e.g. harder rock is represented by far more numerous readings than the weaker rock.
2.4 Correction of Hammer Pressure effect on Penetration
The dependency between Penetration and Hammer pressure and Penetration and Feed pressure is determined by arranging the P and HP as well as P and FP pairs from the Combined Sample and obtaining linear regression. Hammer effect is usually the strongest and needs to be removed from variations of P. For the purpose of the interpretation the linear regression is assumed to adequately represent the relationship. The coefficient of determination R2 of the linear trend line is very low and is inapplicable in general due to large variations of penetration related to variables other than Hammer pressure. The trend can be used to correct the Penetration values by subtracting the portion explained by the regression i.e. the difference between the regression value at particular Hammer pressure and any reference value e.g. average Penetration Pav =(Pmax-Pmin)/2. The selected reference level, as well as the intercept of the regression have no impact on the final result of the interpretation as they are reduced during final scaling of the Penetration to the 0 — 1 a range when using the equation (1). The residual Penetration rates can be understood as deviation from Pav (or other reference value) related to variations of rock quality. This regression trend does not represent rock mass of average quality (due to the likely bias of the Combined Sample) so the residual Penetration can not be used directly for evaluating rock quality. It can be considered as an interim parameter only in the processing. The correction of Hammer pressure effect is carried out both on the Combined Sample and on particular probe log being investigated.
2.5 Scaling the L and HP corrected Penetration to 0 — 1 range
Scaling of the corrected Penetration (often found as normalization) can be performed by application of a formula (1) to L and HP corrected log of particular probe under investigation.
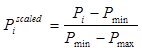
The Pmax and Pmin for scaling purpose are derived from the Combined Sample after L and HP effect correction. Scaling the corrected penetration to the standardized range e.g. 0 — 1 provides an easy tool for interpreting the meaning of the parameter in terms of rock mass condition. Assuming the Combined Sample includes the whole range of expected Penetration rates, Pmax then Piscaled = 1 represents the worst condition (completely decomposed rock or extremely highly fractured rock with thick clay coating on joints) while the Pmin and Piscaled = 0 correspond to the best rock condition (fresh an hard rock with few joints and scarce or no infill on joints). Using the scaled parameter instead of the absolute value of Penetration allows also for comparing the logs and correlating the 0 — 1 range with Q-value or RMR scale, as well as with Rock Grade scale.
3. Example Of Percussion Probing Interpretation
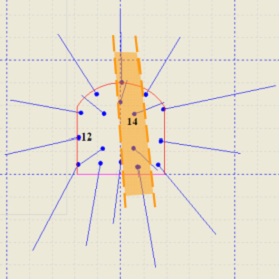
A minor fault encountered in tunnel N of HATS 2A (Sandy Bay to Cyberport) (Fig. 2) was used to test the efficiency of interpreting algorithm.
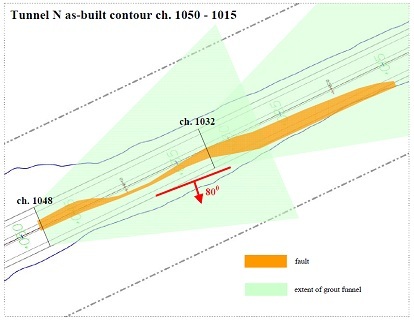
There were two distinctly different rock types covered by the probes that should appear in the interpreted probing results. The rock within the fault was extremely highly fractured, grade I to III, fine grained tuff with abundant unconsolidated clay coating on joints. Total clay content was evaluated as much as up to 50%. The surrounding rock was grade I, fine grained tuff, with scan line estimated RQD around 80%. Discontinuous decomposed rock coating was present on a small percentage of the joints. From the positions of the probes against the fault zone (Fig. 3) it was inferred that probe 12 was fully within the stronger rock mass while probe 14 encountered fault zone material along part of its length.
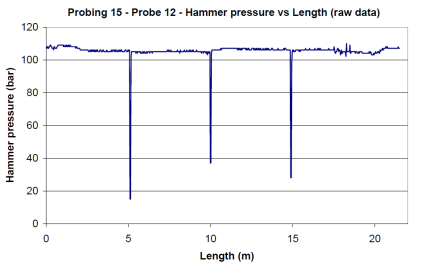
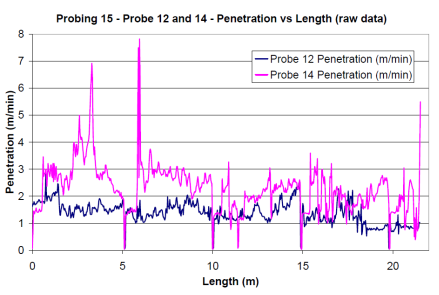
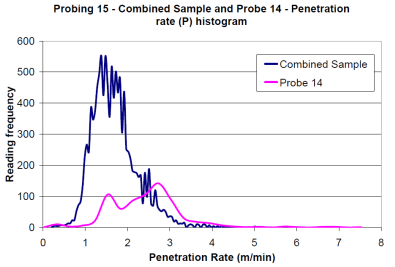
The Combined Sample consisted of data of all 17 grout holes drilled at chainage 1032 of Tunnel N. Filtering criteria — the threshold maximum and minimum values of P, HP and FP — were selected by analysis of raw data graphs of the probes and histograms. Example HP graph of probe 12 shows minor fluctuations of working HP within 100 — 110 bars (Fig. 4) and peaks related to rod changing, hence data containing HP values below 100 bar could be safely removed from Combined Sample as well as from particular logs. The example log of penetration from probe 12 and 14 (Fig. 5) indicates the penetration (and conjoined HP and FP) lower than 0.5 m/min could be filtered out from the Combined Sample and from logs. The upper range filter was assumed as 5 m/min as the upward peaks were related rather to probe cleaning. The histogram plot of penetration from the Combined Sample and from probe 12 (Fig. 6) shows the expected different distribution. Note that the extreme values of penetration are still present in the Combined Sample.
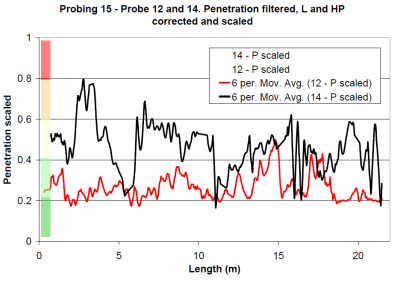
Penetration logs of probes 12 and 14 were corrected for the effect of increasing drill string length (Fig. 7) and subsequently for the effect of Hammer pressure variations (Fig. 8). The regression line shows Length correction significant as it may reach up to 0.7 m/min — 17% of the whole range of the filtered penetration 0.5 to 4.5 m/min. The P vs HP linear regression indicates the possible Hammer correction up to 1.5 m/min (37%) within the range of working hammer pressure. The final scaled penetration parameter is independent from intercept of the linear trend. The corrected values of penetration in the Combined Sample were used for selection of Pmax and Pmin values for further scaling the P record of particular probes 12 and 14 into a range 0 — 1. The obtained parameter after applying 6 point moving average (together 180 mm) is presented on Fig. 9. and proves distinct difference between probes that coincides with their spatial position: 12 within surrounding competent rock, 14 within fractured an partially weathered rock of shear zone.
4. Discussion And Conclusions
There are several sources of error in the proposed processing of the data to obtain scaled Penetration as an indicator of rock properties. These are e.g.:
- simplification of the P - HP dependency to linear and of constant a coefficient irrelevant to rock strength range (Fig. 1A and 1B)
- assuming Hammer, Feeder and Rotation pressure entirely independent of each other
- assuming P — L dependency linear
- omission of Feed and Rotation pressure effect on Penetration
- ignoring water flush effect and drill bit wear on Penetration
- ignoring water inflow effect on Penetration
- Combined Sample not covering the whole range of possible Penetration i.e. whole range of possible rock mass properties.
However, from the objective point of view, which was detecting the extremely adverse rock condition, these simplifications and assumptions showed to be insignificant. The tested algorithm produces a parameter sensitive enough to detect the potentially hazardous rock condition. The completeness of the initial Combined Sample can be verified and amended during the project. Data from other project in similar rock condition can also be used to form the Sample. The advantages of applying interpretative probing based on automated logs of drilling parameters are:
- eliminating safety hazards related to presence of geologist
- obtaining results reliable and superior or equivalent to visual logging
- often eliminating a need of probing as additional activity in the production cycle (grout holes or other technical holes can be used as probes)
- easiness to produce various graphic reports.
References
- Schunnesson H. 1997 - Drill process monitoring in percussive drilling for location of structural features, lithological boundaries and rock properties, and for drill productivity evaluation. Doctoral Thesis. Lulea University of Technology
