Articles
Maxwell GeoSystems maintain an active library of media articles and copies of its latest contributions to trade journals.
The Contribution of Computer Systems to the Management of Geotechnical and Construction Risk on the Klang Valley MRT SBK Line Underground Works
The recommendation of the joint code of practice for tunnel works promulgated by the International Tunnelling Societies and Insurers requires that active risk management form an integral part of every tunnel project. Tunnelling hazards and risks should be constantly viewed during the course of a project with effective systems put in place to do so. These systems should ensure effective communication of risk mitigation actions. Where the response values are reached or abnormal response is observed, then the pre-defined contingency or remedial action needs to be taken in a timely manner. Geotechnical risk management process should not be isolated from other project activities. The communication of risk information and consultation with the project participants are two-way processes that should be proactively undertaken and should continue throughout the duration of the project. Projects are embracing this approach but are finding in practice that that this is somewhat harder to achieve due in part to geographical and functional separation of teams, short time span and the sheer volume of information to be processed. This paper demonstrates how intelligent flexible computer systems were used to assist this process on the highly sensitive Klang Valley Metro in Kuala Lumpur.
Keywords
Data system, risk, tunnel
1. Introduction
The underground portion of the Klang Valley Metro in Kuala Lumpur extends from North Semantan Portal to South Maluri Portal. The tunnels start in the meta-sediments of the Kenny Hill formation and transitions into the karstic Kuala Lumpur Limestone in front of Pavillion in Bukit Bintang. Compared with the SMART tunnel the KVMRT tunnels are much deeper. The tunnels have either a stacked or parallel configuration with cover of about 20m and 30m respectively Both slurry and earth pressure balance TBMs have been used with slurry preferred in the limestone and EPBM in the Kenny Hill.
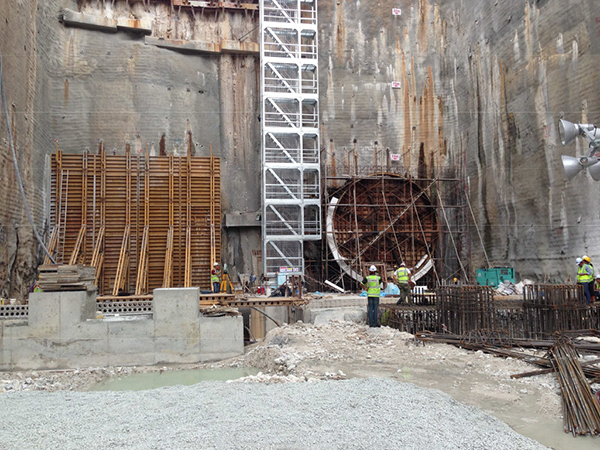
There are many geotechnical risks in the project. The Limestone is known to be karstic with cavities that are either empty or infilled. Both EPB and VD machines were used in the main geological formation with extensive instrumentation onboard had to be monitored real time so that measures can be adopted promptly to evade potential problems. In addition to the instrumentation data from the TBMs thousands of instruments were installed on the surface to measure the impact of tunneling and the construction of deep station boxes to the surroundings, many of which were read in real time. The sheer quantity of data is in itself a risk since staff need to assimilate the monitored data quickly and compare with the expected geology and surface response. Thus a centralised instrumentation data management system (IDMS) was implemented. This paper focusses on the contribution of the IDMS system to the safe completion of the works to date.
2. System Context
2.1 Organisation
The project owner MRT Corporation of Malaysia awarded the USD 3.27 Billion contract to MMC-Gamuda KVMRT-T SDN BHD in April 2012 on a design and build basis. Whilst the main works were contractors design, the owner’s engineer had specified strict control criteria for the works and procedures to be followed should tolerance levels be exceeded. The Gamuda technical organisation comprised divisions looking after geotechnical works, design planning and programming and production. Instrumentation contracts were let under Gamuda and looked after by the geotechnical team which also implemented the IDMS system.
2.2 Key Drivers
IDMS systems had been successfully implemented on the SMART tunnel and in view the heavy levels of instrumentation a similar approach was considered imperative and thus the services of the Maxwell GeoSystems’ MissionOS system were procured to draw in both manual and automatic real time data and communicate changes in the data to the various project teams.
2.2.1 Data Volumes
As of the 2014 some 9500 instruments have been logged and of these almost 1200 instruments are real time resulting in 15 million records of data amounting to 100GB of data. Such a volume would be impossible to manage without IDMS especially as the protection of surrounding infrastructure is one of the key factors.
2.2.2 Feedback
At the inception of the project the planning and production team considered the need for proper feedback of ground and groundwater movement data to the designers and tunnel and station managers so that the effect of ground conditions on tunneling processes and station box excavations be better understood. For this to be effective audited data had to be presented to the user quickly. It was also hoped that the IDMS would become a back bone to the risk management process.
2.2.3 Timeliness
During the tunneling works the TBMs could advance as much as ten rings in a day therefore it was vitally important that data could be delivered to the IDMS within one day of being recorded. This too was crucial during the station box excavation. Uploading processes in the IDMS were automated and data could be filtered processed review, audited and published within one hour of receipt.
2.2.4 Data Quality
With rapid delivery of data, quality can fall and any way to simplify the data management will potentially lead to improvements.
2.2.5 Data Verification
The project is extremely sensitive and the consequences of false alarms are damaging. As such it is important that all data is verified before being published to the public domain. Rapid verification and confirmation of results is an advantage particularly if coupled with independent processing.
2.2.6 Tools
In order to convince staff to move away from the use of spreadsheets for data analysis the system would need to enable the user to do more with the data more quickly than they would in normal circumstances. If coupled with fully customizable reporting users would accept the concept of centralized data resources.
3. Procurement Of The System
The system was procured on a supply and maintain basis with the instrumentation and TBM contractors required to feed data to it. In the early stages it became clear that there was a need for an additional data auditor in order to achieve reliable timely data. Inputs (data Sources) to include:
- Mapping-Air photos/ construction drawings
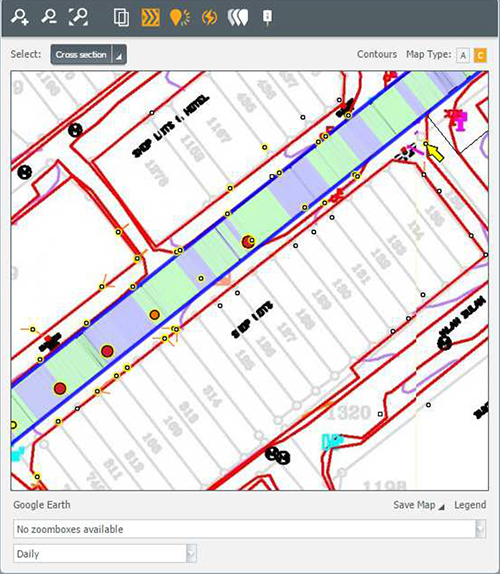
- Dimensions and setting out- cross sections of the major construction elements.
- Alignments- Control line coordinates and position on the tunnel cross sections.
- Progress- Simple chainage vs. date
- Boreholes- AGS data or simple Summaries A PDF logs
- TBM data- Parameters taken direct from the TBM data loggers.
- Customisable reports for any parameter
- Data downloadable to excel
- Secure access, secure data including archive and daily backup.
- Accessible via Windows, iOS and Android devices including touch screen and smartphones.
4. Processing Methodology
4.1 Data loading
Instrumentation data was sent from the subcontractor to the MissionOS IDMS by FTP. Automated email collection and manual file upload was also made available. A requirement of the IDMS was that data be presented in raw format and processed independently as a check. A format was developed composing of a data file and a setup file. On revision a new setup file was to be provided with the new instrument settings. In reality data would often arrive before its setup file or revision file and therefore systems were put in place to recognise jumps and spikes in the data which would require further information from the contractor. The IDMS was configured to alert the administrator when such data had been received such that timely action could be taken. Many IDMS data management processes were completely automated including: correction for inclinometer pipe top changes, correction for MPBX or piezometer pipe top level changes, corrections for benchmark movements and instrument temperature correction amongst others.
4.2 Alarms
Before alarms from real time data systems were sent out care needed to be taken to recognise and quarantine values exceeding credible thresholds or potential spikes. Instruments fluctuated due to natural temperature variations and, in the case of piezometers, due to seasonal changes and it was important to avoid unnecessary alarms.
4.3 Data Audit and Quality Assurance
All data was quality assured by running weekly data audits in excel. The resulting files were sent to originators for correction/completion and the files uploaded to update the database. Each audit file was saved as a record of the state of the database at that time.
5. Data Analysis And Outputs
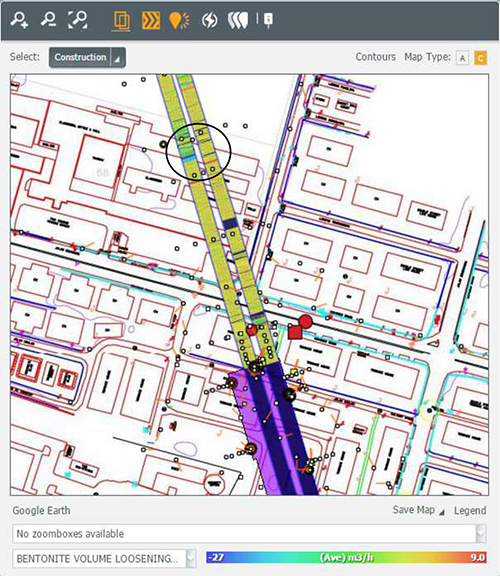
The main use of the system was directed at instrumentation data management and response. Since the IDMS was a client requirement the initial focus was on fulfilling this requirement. On completion of this exercise it was further developed to address contract reporting and this was well received as a tool to produce the reports. Few on the production team used the system since it was seen as a duplication of the proprietary process control tools on each TBM. The intention of the system however was not to duplicate or replace the TBM control system used for driving the TBM but to provide a wider forensic capability to investigate ground movements, TBM performance and, through back analysis, arrive at predictions of future best practice. The open customisable reporting system and the fact that data could be combined in plan, section and graph enabled the relationships between tunnel driving parameters and ground/building response to be investigated. The system provided tools to generate a variety of custom reports using an interactive means of saving report definitions. These report canvases could be pre-prepared and brought up at any time which made them ideal for daily PTT (Permit to Tunnel) Risk Assessment reviews. Combinations of any parameters could be plotted with one common axis. For example a long section plot of settlement against chainage could be plotted on top of a plot of face pressure.
6. Case Histories
6.1 Cochrane trial section
The first variable density TBM drive (Klados et al. 2015) was driven from Cochrane shaft towards Pasar Rakyat at a depth of about 30m through KL limestone. The subsoil profile developed from boreholes and geophysical studies indicate that this section was typical karst with potential cavities and intrusions into the TBM path.
The ground ahead of this first section had been cleared therefore this section gave a good opportunity to test the capabilities of the variable density machine. The machine performed well in consistent limestone up to chainage 8180 but here hit a karstic feature venting slurry to the surface. After several rings (Figure 6.2) the ground was more competent and normal tunnelling resumed. This event acted as a valuable dry run where the capabilities of the VD tunnel boring machine was tested as a prelude for similar cases where such karst intersections would not be within open ground.
