Client-Contractor Collaboration For Integrated TBM Process …
For many years partnering has been a well-established principle for promoting a “best for project” culture within a construction contract. This endeavours to remove the adversarial nature of classical “engineer’s design” contracts by openly discussing issues which may impact on project performance and look to engineer ways to mitigate them within the terms of the contract. These discussions rely on information and often the data available to client, engineer and contractor is incomplete, different or ‘selectively’ chosen to support a particular point of view. On many contracts clients have implemented project wide systems either independent of the main contractor or as part of the contractor’s specification and these have seldom provided the common information base desired in order to facilitate the partnering approach. The Powergrid Cables tunnels in Singapore represent the first time that all contractual parties have contributed to the implementation of project wide data management systems. The paper will describe the systems; their technical capabilities within TBM process and geotechnical control, their implementation and the contractual framework origins within which they have been delivered.
Keywords
Data system, Partnering risk
1. Introduction
The North-South, East-West and Jurong Cable tunnels currently under construction by SP Powergrid in Singapore are the second set of deep tunnels constructed by Singapore Power. The first phase of tunnels faced a number of challenges many relating to tunnel depths in excess of 40m below the water table. The most acute of these challenges involved flowing sand conditions which led to a stoppage of several months on one TBM drive.
In planning phase 2 of the scheme the designers were also obliged to set the tunnels deep to avoid other infrastructure such as metro, sewage, drainage culverts and road tunnels. At this depth, the tunnels would be passing though old alluvium, decomposed granite soils, metasediments of the Jurong Formation and Bukit Timah Granite with a high proportion in mixed face. Occasional exotic conditions such as lavas, eutaxites and ignimbrites in addition to volcanic breccias would be expected. Faulted ground was expected and in some cases is suspected to be linked to hydrothermal water. The water table is high and the near surface soils including peat, alluvial clays and residual soils are sensitive to water drawdown.
2. Risk Management For Tunnel Works
2.1 Singapore Practice
Since 2004 the practice in Singapore has been to promote independence of the parties within a construction project. The contractor’s design responsibility is normally limited to the temporary works elements.
In this structure the parties are clearly divided and are less able to influence each other. However, the flow of information between the groups may be hampered by the lack of incentives to cooperate. The concern is that each party will only do their minimum scope of works. The instrumentation contractor is only required to measure instruments and has no obligation to follow the works going on beneath his feet. He is not obliged to comment on where the tunnel is or on any underground changes which may affect the instruments. The instrumentation contractor many be required to provide a database but only for real time information and with no information concerning the progress of the works. Conversely, the main contractor cannot influence the positioning or type of monitoring undertaken and receives mostly paper reports which make it difficult to interpret what is occurring. Table 1 shows the main divisions in Singapore Contracts.
| Group | Members |
|---|---|
| Contractor | Qualified Person Design (QPD) Constructor Specialist Tunnel Instrumentation and GI Contractor |
| The Public Private Partnership | Designer Qualified Person Supervision Instrumentation Contractor GI Contractor |
| Independent | Accredited Checker |
| Authority | Building Construction Software Authority |
2.2 Requirements for Successful Risk Management
The Code of Practice for Risk Management of Tunnel Works (ITIG 2006) recognises that risk management should be practiced by all parties of a project and across all contracts. There should be adequate communication of information and involvement of all parties on a frequent basis. Risks should be identified and evaluated and where possible removed, otherwise mitigated. The process should be formalised with drivers assigned to control it. The drivers should produce a live register of risks and constantly evaluate and update this in light of the information gleaned. It is the responsibilities of all parties to contribute to ensure this happens and that the risk platform is current and communicated.
2.3 Risk Management in Practice
Risk management is not about a deliverable, it is about a process. The live register of risks might seem like a report but a report is only one very time consuming way of communicating information. The report is not the register and can never be live if it must be constantly updated and re-issued.
This highlights a perennial problem in engineering construction, the formal submission. Formal submission takes time and must be signed off by several parties. The only formal documents are printed ones. Within this landscape a risk register would never keep track of the changes in construction and its information would never be communicated to the people who need to be informed.
The requirement for constant review and updating involves reviewing all the progress and production results in light of changes to construction methodologies, incorporating new ground investigation and instrumentation information as soon as it arrives and information on observations around the work site in the form of memos, photos. Using normal data management (eg spreadsheets, email) would tie the risk manager to his/her desk for such an amount of time that they would become less effective at managing risk. There must be other ways to do this.
2.4 Risk Management on the Powergrid North-South, East West and Jurong Tunnels
The issues described above were recognised at an early stage by both the Powergrid directorate and their consultants. Previous cable tunnel projects which had encountered significant settlements during construction stage triggered the need for comprehensive instrumentation data management systems. It was hoped this would allow all parties (client, consultants & contractors) to access realtime monitoring data as well as the construction activities carried out at site through a common platform that provide interactive functions to generate graphical plots linking the monitoring data and the construction activities. Based on the cause and effect information, the system will allow the project team to predict, forecast and use the system as the risk management tool for lookahead construction activities.
In common with Singapore government projects the instrumentation contracts were directly let under the owner and supervised by the QPS. Centralised collection of these results and site observations from the QPS teams would be straight forward but the collection of tunnelling information would need the cooperation of the contractors.
The Client negotiated with all six contractors on the project to request them to contribute to a centralised system for the management of risk as part of the partnering process. The cost of the system was equally shared by all seven parties including client and contractors. Whilst still seen by the contractors as an owner’s initiative, the requirement to have a financial stake motivated contractors to use the system for their benefit.
The system scope and delivery was managed by a steering committee with representative from all the financial contributors. In addition to providing the system the IDMS consultant also provided staff to maintain the data and provide a line of communication for users. The team was managed by an experienced instrumentation and geotechnical engineer.
3. The Instrumentation Data Management System (IDMS)
The scope for the IDMS comprised the following base requirements:
- Be web based and shall display using interactive maps and graphs.
- Be platform independent and shall operate on Windows, iOS, Android, Linux on both PC, tablet and smart phone.
- Present borehole data including key geotechnical parameters
- Present instrumentation data from the Monitoring Contractor (IMC) and the Contractors monitoring provider including both manual and real time data.
- Present tunnel data including real time TBM parameters, tunnel progress results, rock mapping and support information, record photos.
- Plot and display data to screen, PDF and excel within acceptable time frames.
- Allow user customisation of reports and views
- Manage alarms and alerts
The Maxwell Geosystems MissionOS platform was selected as the solution. This existing system was implemented quickly and was ready to receive data within 2 weeks and fully operational within 3 months.
The system operates on a dual level with raw data at administrator level separated from processed data public level. At administrator level the staff can see all the data including data in error and have the option to quarantine data for later correction and adjustment. Staging servers sit on sites collecting site data performing preprocessing and sending to FTP servers and then to Linux/Apache web servers for processing and updating MySQL databases. Background server administrator level databases are both physically separated and platform separated from the web LAMP environment. This makes the systems extremely robust and protected from single point of failure.
3.1 Data Processing
A fundamental requirement for the system is that quality data be delivered quickly to the end user. The objective is to achieve data delivery before the daily tunnelling review meetings which normally take place at 8am. The only way to achieve this reliably is to automate as many data processes as possible on the server side. It was also decided wherever possible to take raw data into the system rather than processed data. This enabled data to be delivered to the MissionOS more quickly from the field and also for independent processing to be carried out. In this way all carries, resetting and other adjustments to the data were completely transparent to the party needing to use the data. Examples of automated data processing include:
- Auto-correction for temporary benchmark movement.
- Correction for pipe top level changed either through extension or reduction or settlement
- Correction for inaccessible holes eg blocked inclinometers, damaged MPBX.
- Auto-revision of settlement points
- Temperature and tidal adjustments
3.2 IDMS capabilities
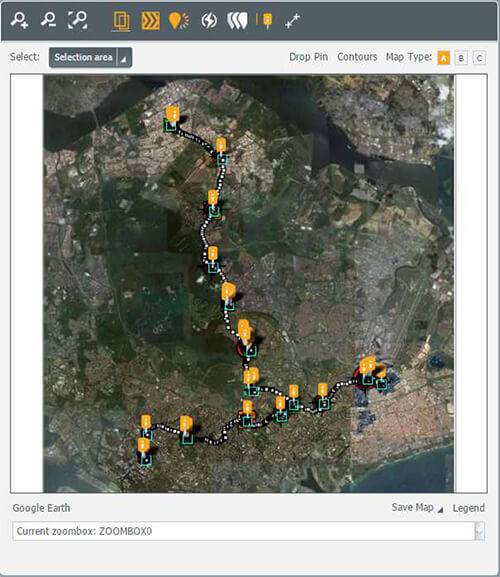
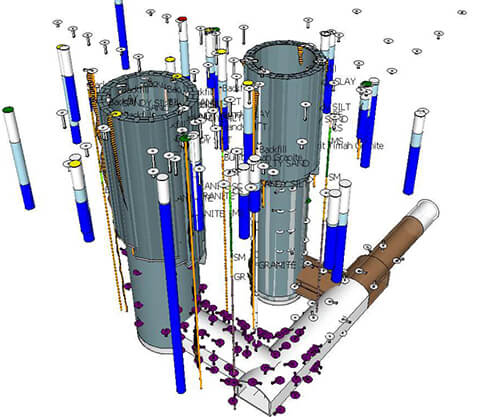
The IDMS brings together information from investigation, design, production and monitoring. The system enabled all users to see the current status of their part of the project and some part of adjacent contracts where there was an interface.
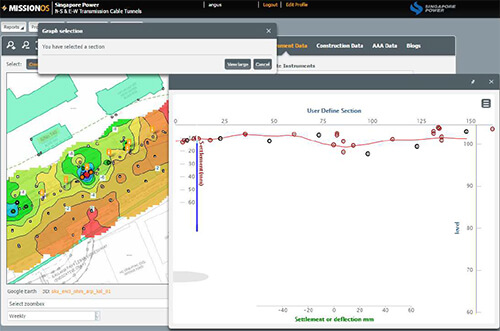
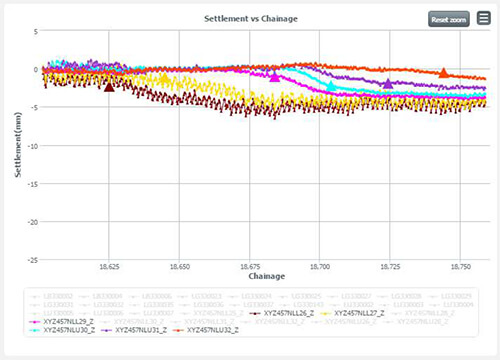
Each element of data can be queried and plotted both singly and in groups and can be combined with other elements for plotting either of common axes or against each other. Information can be plotted as plan and sectional map views with overlain contours, as schematic user defined sections, as graphs against time or as X vs Y. All graphs are highly customisable. With all data spatially related analyses can be undertaken in terms of proximity to construction faces as the graph in Figure 3.5 shows. These spatial relations are calculated on the fly and are useful tools for analysing settlement development around the tunnels in varying ground conditions.
3.3 IDMS utilisation
The utilisation of the system by the user base is shown in figure 3.6.
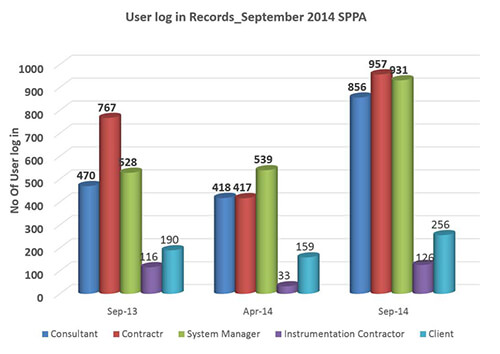
There are many challenges to driving IDMS utilisation. There is an in built inertia which resists the move away from systems that have been in place for many years even if extremely inefficient. There is a reluctance to let go of the ‘ownership’ of data and a general desire to be innovative. It is a popular misconception that a system will take the ability to innovate away from the Engineer. Despite this resistance it is only a matter of time before expert systems are the norm. The high level steering group has driven the utilisation of the system at all levels. The systems are used at instrument review meetings and to produce reports across the project. To build on this a number of features have also been implemented to make use of the systems desirable.
3.4 Initiatives To Increase Utilisation
3.4.1 Canvas Reports
Surprisingly the power of the system has proven a drawback since with wider data coverage and more analysis options comes an increased requirement for training and expertise, regularly refreshed. For live presentation purposes it was felt that users preferred to be able to pre-prepare reports for display rather than try and use the system live. Rather than have these as static reports the system provider has implemented an interactive canvas sheet system where the definition of each graph, map and section created interactively can be saved and used as components on a canvas. These can then be combined with fields and tables of data to produce content rich reports. These reports can be reproduced at any later stage and contain the latest data.
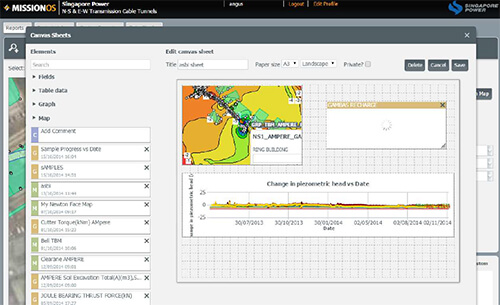
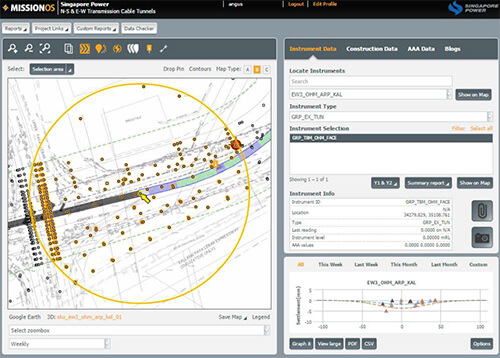
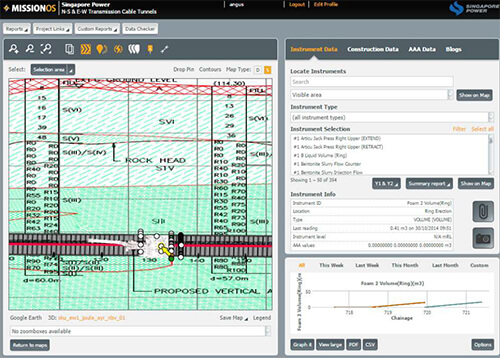
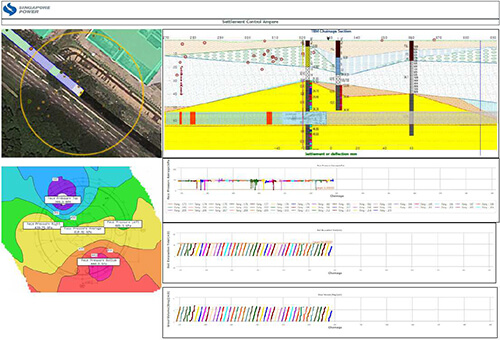
Canvas reports can also be easily configured to be regularly updated and become control screens. Figure 3.5 shows a control screen summarising live TBM, geotechnical and instrumentation parameters for the control of settlements due to tunnelling.
3.4.2 Group instruments
In addition to basic measured parameter the MissionOS IDMS provided options to combine parameters either to derive other parameters ie two utility settlement points to define a tilt, or to display parameters in such a way to enable interrelations to be visualised. This was most commonly applied to measuring structural distortion of utilities, temporary works such as shaft linings and affected structures along the alignment.
3.4.3 Digitising hazards and sensitive structures
As part of the risk mitigation details of the buildings were digitised to the system by the contractors, relevant details input and documents attached. Important details such as the maximum strain levels of structures in various modes are added and since the hazards are geographically referenced to the systems they are referenced back to TBM data logging and other instruments. Building groups were also created to produce reports focussing on the key building parameters.
3.4.4 AAA management using social media and blogging
Conventional AAA schemes rely on email and sms to deliver notifications. Feedback as a result of these notifications is normally by email and as such becomes immediately defuse. The IDMS has instigated an adaptation of secure social media blogging to enable feedback to be delivered to the relevant group. Each alarm starts a thread and responses relating to that thread are added by members of the user group. Photos and other attachments can be added. Whilst this was welcomed by the consultant and client, the Contractors were less willing to use the blog mainly due to the fear that uncontrolled commentary may have contractual implications.
3.4.5 Simplified Progress Management
A common hurdle to adoption of the systems is the complaint that entering the data involves additional work and this is particularly true in the case of progress reporting. To surmount this a simple template was prepared for as set of key items extracted from the construction programme focussing on key items to be tracked. The site engineer or inspector only had to input the date and time and the chainage for the activities in progress on a daily basis and email it to a dedicated email address where it would be picked up and processed automatically. This proved to be considerably less time consuming that their regular site processes.
3.4.6 Record Photographs
A simple but appreciated modification is the ability to add site photos to items of construction and to locations in the map. By geographically locating the photos they are immediately set in context with the data to which they are linked which increases their value to the user.
4. Discussion
The management of risk on tunnelling projects is the responsibility of all parties. In order to manage risk effectively the large quantities of data collected must be audited and assimilated rapidly with other data feeds to assist engineers to study both the effects of tunnelling and the potential causes. With many millions of records and gigabytes of data this can only realistically be achieved using systems. Careful consideration for the system delivery method is essential to ensure that it is utilised by all parties. Incorporating the systems within partnering agreements has been an effective way to achieve this.
References
- ITIG (2006). A Code of Practice for Risk Management of Tunnel Works. The International Tunnelling Insurance Group (in association with the Munich Re Group), 37p.
Follow our socials!


