
Infrastructure Data Intelligence Platform: What It Is and Why Mega-Projects Need One
An infrastructure data intelligence platform is a centralized digital environment that pulls together instrumentation, survey, sensor, and contractor data from a construction project into one live, queryable picture, instead of scattered spreadsheets and disconnected systems.
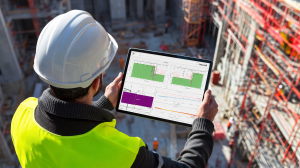
Mega-projects tend to run into the same problems without one: data trapped in silos, different contractors using different tools, slow communication about emerging risks, and alarm systems that either miss real warnings or bury them in noise.
MissionOS Monitor, built by Maxwell GeoSystems, is one such platform. On Hong Kong’s HKD$65 billion Express Rail Link, it became the shared database that let engineers, contractors, and the client track ground movement, structural performance, and monitoring compliance across 14 separate construction contracts from one system.
What Is an Infrastructure Data Intelligence Platform?
An infrastructure data intelligence platform is a centralised digital twin environment that pulls in data from every corner of a construction or civil engineering project — instrumentation readings, survey data, IoT sensors, GIS layers, remote sensing, and contractor reports — and turns it into one live, queryable picture of what’s actually happening on site. Instead of a dozen spreadsheets and siloed systems, project teams get a single source of truth that updates in near real time and can be checked by anyone from a site engineer to a program director.

The value isn’t just storing data. It’s turning raw feeds into decisions — flagging where ground movement is approaching a threshold, which contract is falling behind on monitoring compliance, or where a digital twin reveals a clash between the design and what’s actually been built.
Why Do Mega-Projects Struggle Without One?
Large infrastructure programs rarely fail because of a single bad decision. More often, they fail from a thousand small ones made on incomplete information. A few problems show up again and again on large programs:
- Data silos — geotechnical instrumentation, BIM models, survey data, and contractor reports often live in separate systems that don’t talk to each other.
- Software fragmentation — different contractors on the same project frequently run different monitoring tools, making it hard to compare results across contract boundaries.
- Delayed communication — by the time an anomaly surfaces in a weekly report, the window to act on it cheaply may already be closing.
- Alarm fatigue and missed signals — with millions of readings flowing in across a project, manually reviewing everything isn’t realistic, but poorly configured automated alerts create their own noise problem, burying real warnings under false positives.
MissionOS Monitor, built by Maxwell GeoSystems, is designed specifically to answer this: a cloud-based platform that ingests spatial, construction, and instrumentation data from multiple sources at once, and keeps everyone — owner, contractor, and consultant — looking at the same picture.
How Does MissionOS Approach This Problem?
Rather than treating monitoring as a reporting afterthought, MissionOS sits underneath the project as connective tissue between systems. It works through five main capabilities:
- High-capacity data ingestion — the platform is built to absorb data from boreholes, IoT sensors, gateways, CCTV feeds, InSAR satellite data, and remote monitoring systems, with full audit trails on everything that comes in.
- Configurable, multi-tenant dashboards — different stakeholders need different views of the same underlying data. An owner wants program-level risk; a specialist contractor wants readings from their own instruments. MissionOS lets each user group configure dashboards, alarms, and reports without duplicating the underlying data.
- Automated reporting through Canvas tools — custom dashboards, graph libraries, and scheduled report binders mean insights get pushed to the people who need them instead of waiting to be pulled.
- GIS-first visualization — data is shown in its proper geographic and temporal context on interactive maps and digital twins, rather than buried in lists, which is a large part of how the platform helps engineers spot patterns that spreadsheets hide.
- Open integration — APIs support connections to Power BI, Excel, Python, and R, plus FTP, SMTP, MQTT, and custom web services, so the platform slots into existing corporate data ecosystems instead of replacing them.
What Are the Key Benefits?
- Multi-stakeholder collaboration — owners, contractors, and consultants work from the same live dataset instead of reconciling conflicting reports after the fact.
- Cross-contract transparency — on programs with dozens of parallel contracts, a shared platform makes it possible to compare performance and risk across contract boundaries rather than contract-by-contract in isolation.
- Reduced risk of data loss — a centralized, cloud-hosted repository with audit trails means critical monitoring history doesn’t disappear when a contractor demobilizes or a spreadsheet gets misplaced.
- Faster, more targeted alarms — configurable thresholds and automated escalation cut down the lag between an instrument reading and a human being aware of it.
Where Does This Kind of Platform Apply?
Programmatic, platform-level data intelligence tends to matter most where projects are too large or too fragmented for manual coordination to keep up:
- Programmatic management of mega-projects — coordinating monitoring, risk, and progress data across an entire multi-contract program rather than one site at a time.
- Automated multi-contract auditing — comparing instrumentation compliance and monitoring performance across contractors working under the same program.
- Regional-scale GIS tracking — following ground movement, structural performance, or asset condition across an entire corridor or district, not just a single worksite.
Client Example: Express Rail Link, Hong Kong
The Express Rail Link (XRL) is a HKD$65 billion rail project in Hong Kong spanning roughly 26 kilometres, including some of the city’s largest-ever retained excavations at its terminus station. Maxwell GeoSystems was appointed as lead consultant on the project’s Independent Monitoring Consultancy, advising the MTR Corporation and reviewing results submitted by instrumentation contractors across 14 separate construction contracts along the alignment.
The MissionOS Portal became the backbone of the project’s United Web Database (UWD) — the shared system all parties relied on. On the station contract, the team worked with MTRC engineers to compare real-time ground movement against design predictions and excavation progress, while tracking structural distortion in nearby utilities and buildings. On the tunnelling contract, the system had to handle a mix of monitoring types — strut loads on existing structures, ground vibration, and tunnel convergence — often excavated using retained excavation, bored tunnelling, and drill-and-blast methods side by side.
The UWD’s alarm notifications and integrated web-log for recording commentary meant the project had one continuously updated audit trail rather than fragmented contractor reports — precisely the coordination problem a data intelligence platform is meant to solve at scale.
Platform Capabilities at a Glance
| Capability | What It Does |
|---|---|
| High-capacity data ingestion | Absorbs data from boreholes, IoT sensors, gateways, CCTV, InSAR satellite feeds, and remote monitoring systems with full audit trails |
| Configurable multi-tenant dashboards | Lets each stakeholder group (owner, contractor, consultant) view the same data through their own dashboards and alarms |
| Automated reporting (Canvas tools) | Pushes custom dashboards, graphs, and scheduled report binders to the people who need them |
| GIS-first visualization | Displays data in geographic and temporal context via interactive maps and digital twins |
| Open integration | Connects to Power BI, Excel, Python, R, FTP, SMTP, and MQTT so it fits into existing systems |
Frequently Asked Questions
Follow our socials!