The MissionOS platform drives infrastructure efficiency, keeping data alive and encouraging user collaboration through enhanced connectivity.
The MissionOS platform drives infrastructure efficiency, keeping data alive and encouraging user collaboration through enhanced connectivity.

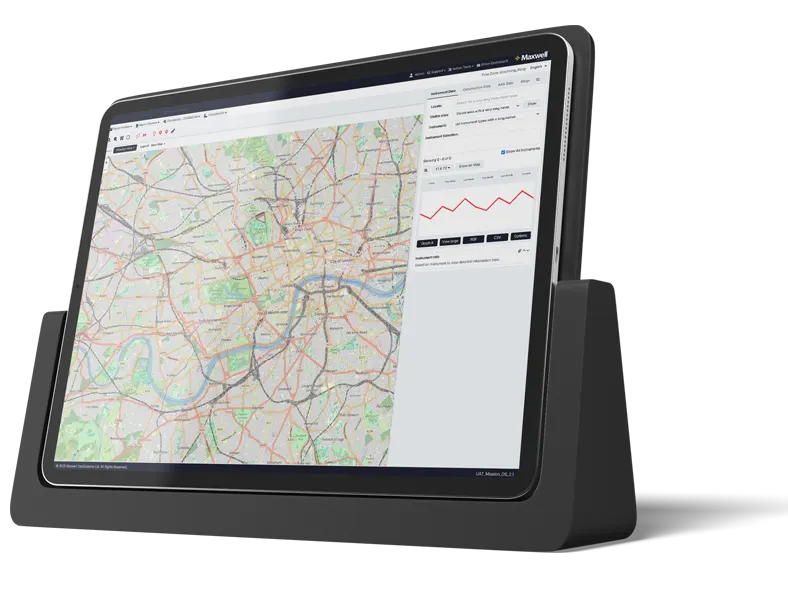
MissionOS data is presented in map format using a flexible, easy-to-use Geographic Information System (GIS) that allows for the display of data values through a variety of symbols and colors combined with historical context. The system empowers engineers and construction professionals with a bird ’ s-eye view of their jobs with data in its proper geographic place and relevant contextual surroundings.
MissionOS is suited for civil construction and infrastructure; this versatile data platform operates seamlessly on any browser, accessing robust cloud-based database structures for enhanced configurability and efficiency.
Using Application Programming Interfaces (APIs) and other tools, MissionOS acts as an integrator between systems, ensuring that both qualitative and quantitative project data remain accessible and not lost in documents.

MissionOS, with its interactive GIS, is a perfect system of record for construction. Instead of data stored in endless lists, it is presented visually and in its proper geographic and temporal context.

Most people are used to visualizing and interacting with spatial data through maps. All MissionOS data is presented in map format in a flexible, easy-to-use GIS with the ability to display data values visually.

The extensive use of APIs within MissionOS opens up connections to Python, R, and other similar systems, making it a platform for advanced analytics and AI.

MissionOS is highly interactive, allowing users to load various design calculations into the system to make predictions, which are then automatically published to end users via the GIS.

Not all BIM systems have to start with CAD. MissionOS is a data modeling environment ideal for creating common environments for data. Within MissionOS, users can create data workflows and internal calculations.

MissionOS is the global leader in instrumentation data management and system integration. The platform has supported many of the world’s largest and most complex projects.

The MissionOS system absorbs and presents machine data with less than 5 seconds of latency, combining it with other project-related data for enhanced project control.

3D realizations of any region of interest for the works can be generated live, combining all data with any spatial attribute in ways that help to communicate inter-relationships.
MissionOS gathers data from widely dispersed sources into a single web-based portal creating a powerful and dynamic workspace for all participants throughout the project's duration.
 Document
 Geospatial
BIM Model
Assest Data
Simulation
Cost
Programme
Risk
Control
Sensors
REQS
Health & Safety
Distance / Time
Contract
Geospatial
BIM Model
Assest Data
Simulation
Cost
Programme
Risk
Control
Sensors
REQS
Health & Safety
Distance / Time
Contract
Connect directly with a Maxwell GeoSystems support expert via email, or live chat.
Gain access to MGS Learn, the online learning platform for free, self-paced courses on product and topic-based certifications.
Discover all the latest product information on MissionOS and share your experiences with other system users.