For repeatable tunnel data feedback, gather structured information through automated or semi-automated means using MissionOS
For repeatable tunnel data feedback, gather structured information through automated or semi-automated means using MissionOS

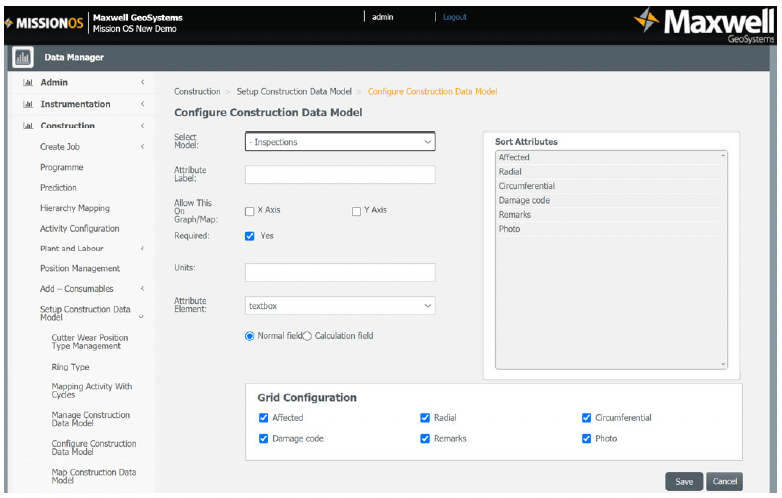
In order to do repeatable feedback on tunnel data first the information has to be gathered in structured automated or semi‐automated ways. The MissionOS platform has a completely configurable and dynamic data model which enables users to create tables.
Monitoring objects include sensor data recorded both manually and in an automated data‐logged way. These include data from environmental, geotechnical and structural monitoring and data streams from machines.
The GIS capabilities of MissionOS are used to effectively store layers of geospatial data such as topography, land-use, ground-hazard and settlement sensitivity, rainfall etc. All these can be used as a part of the analytics process.
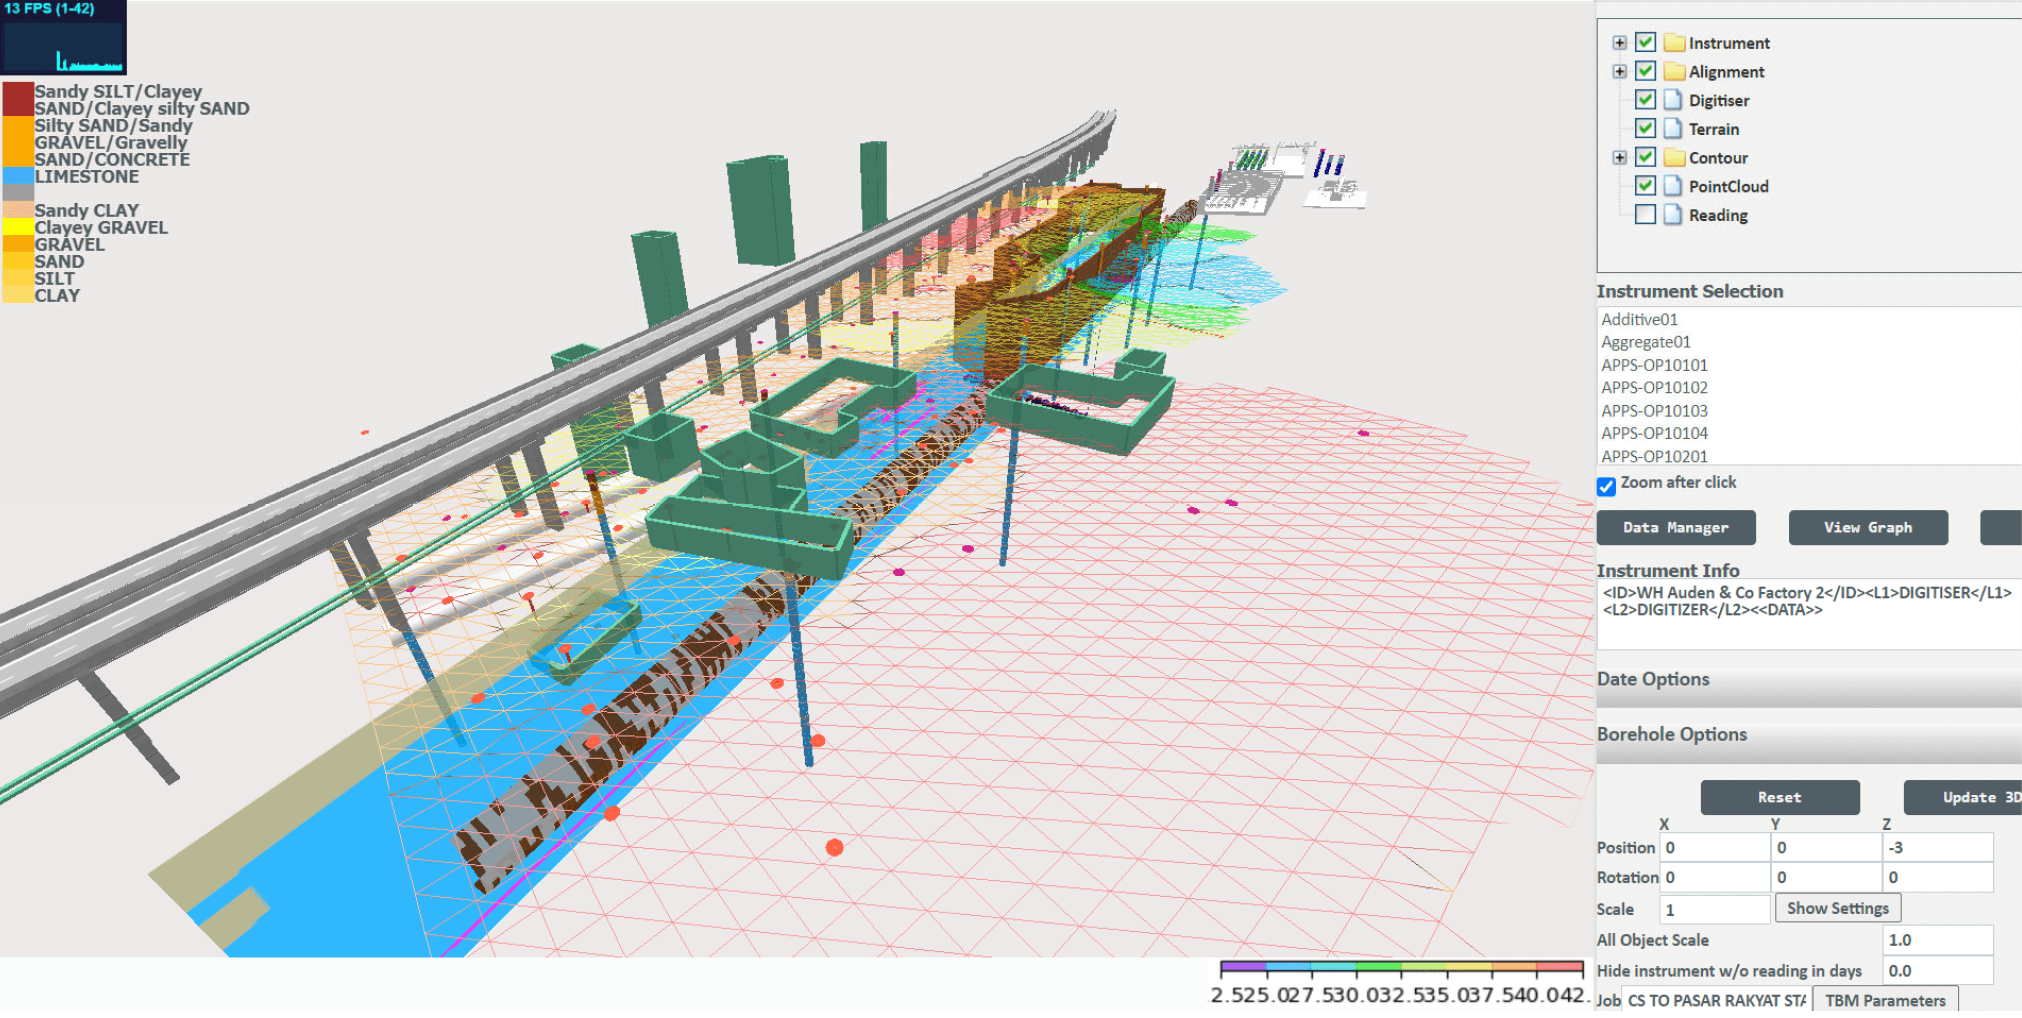
Construction objects are the objects to be built either as temporary or permanent works. These are often identified within the project BIM (Building Information Modelling) and are supplemented with records of completion progress and metadata.
Time And Costs
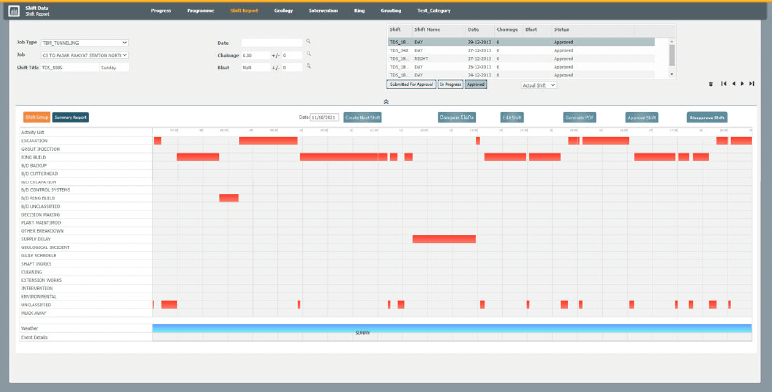
In addition to simple progress records users can define activity recording schemes build around delays codes. These activity schemes can be applied to the Master or Parent activities and can track the activities behind the production of each sub-job element.
Various shift management options are available from simple manual reports to zones based and fully automated production monitoring linked to multiple machines.
Metadata Records
Each time entry can be linked to progress of a job and can also be linked to a set of data records.
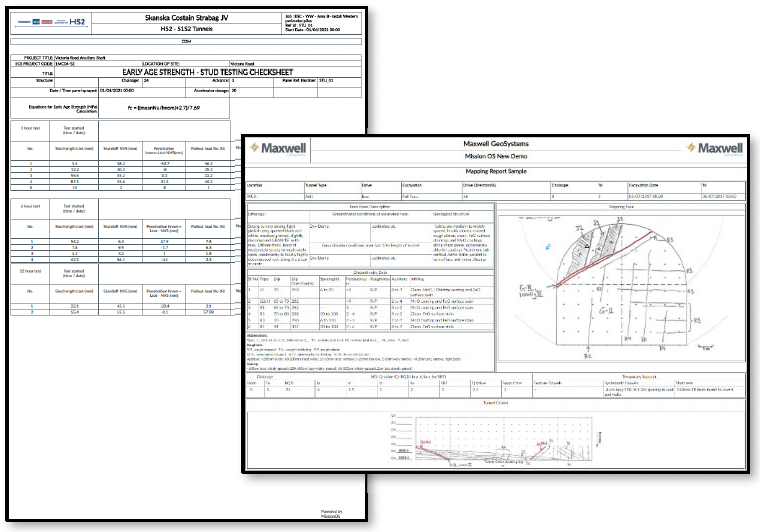
For instance, concreting can be linked to a series of records relating to the concreting process from batch requests to delivery notes to QA/QC test results and inspections.
Each data model can be adapted to your own requirements including the standardisation of nomenclature and this is the key to the success of any future analytics.
The data models are used to generate reports as required by contract specifications and these can be fully automated to save time and resources.
Before “Big Data” can be analysed and compared it must be summarised into statistics which facilitate analysis. These must have a common basis for comparison.
Defining summarising methods to ensure optimum correlation opportunity. Within MissionOS, users can define cycles which have some relevance
to construction. For a building, these might be concrete pours, for a tunnel blasts, rings, PEG rounds etc. Ultimately the various data collected within
MissionOS summarised into statistics based on each of these cycles. Similar cycle types from job to job can then be effectively compared.
The way in which the statistics are derived strongly influences and correlations that can be drawn and this is where Maxwell GeoSystems provide advice to our clients and the tools to create the summarising functions.
Each cycle accumulates statistics from each function. These can include any metadata records either recorded manually or from the machines.
In addition to metadata linked directly to the job there is spatial and sensor data which influences the job performance and is influenced by it.
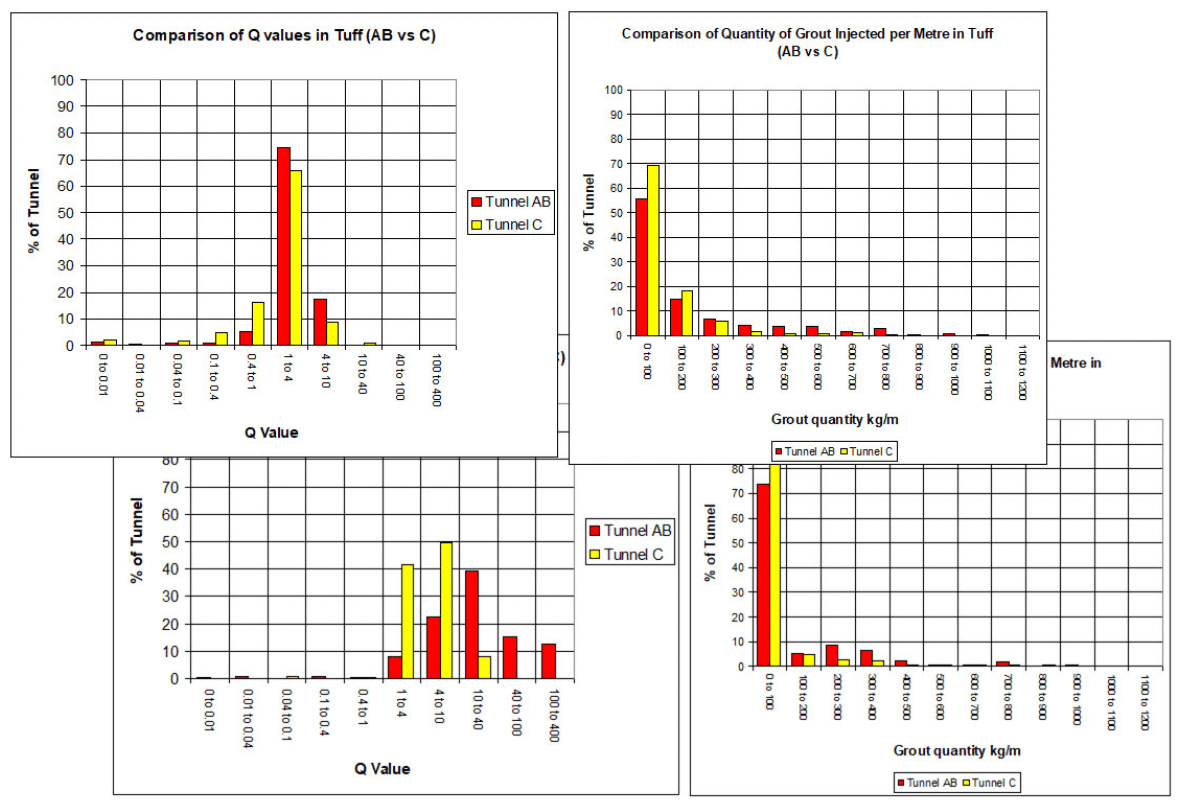
MissionOS has a variety of built-in methods to summarise the spatial data into cycle statistics such as overburden, rock type, soil-sensitivity
classifications (see Geostatistics later), groundwater head above tunnel level. MissionOS digitised layers under a building or structure or not (or not
known) etc.
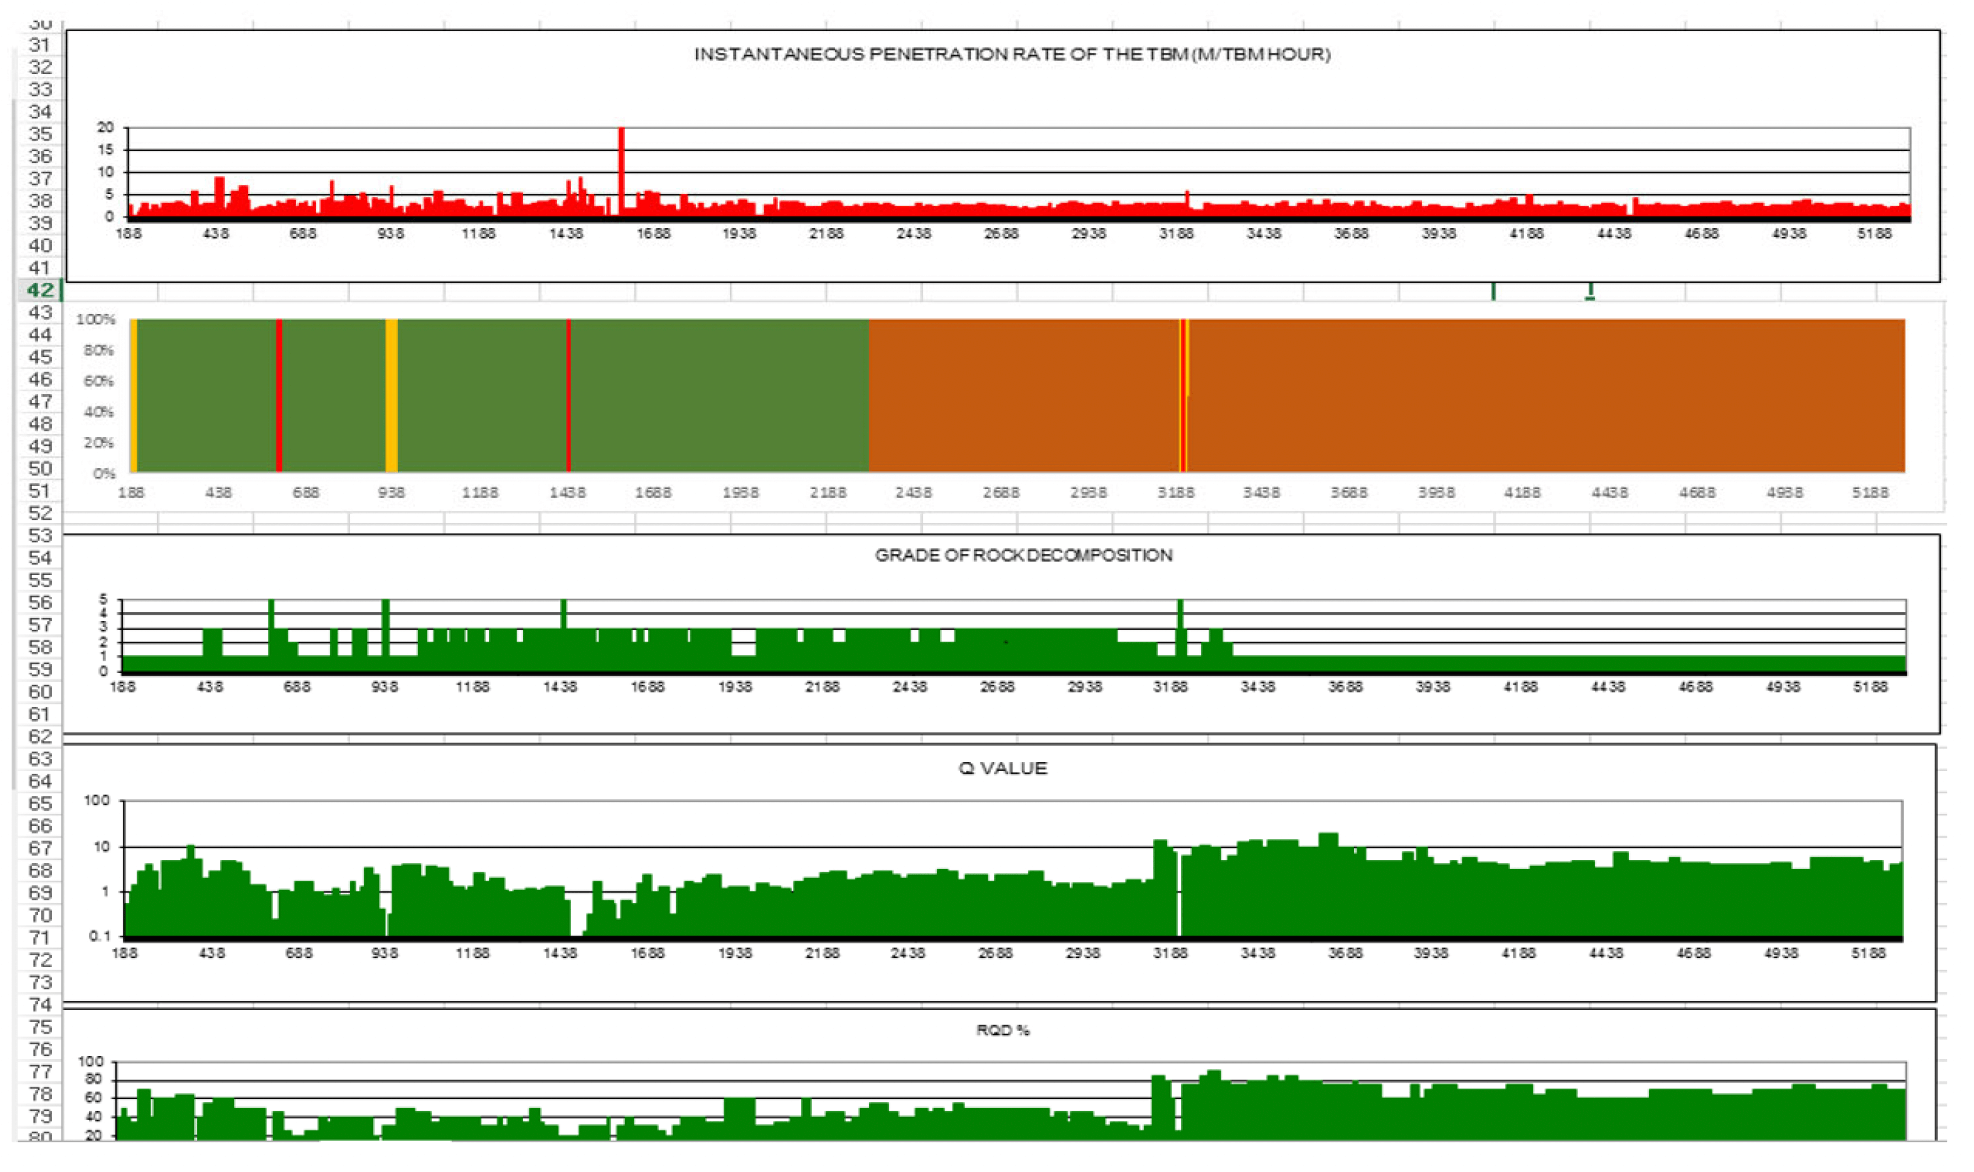
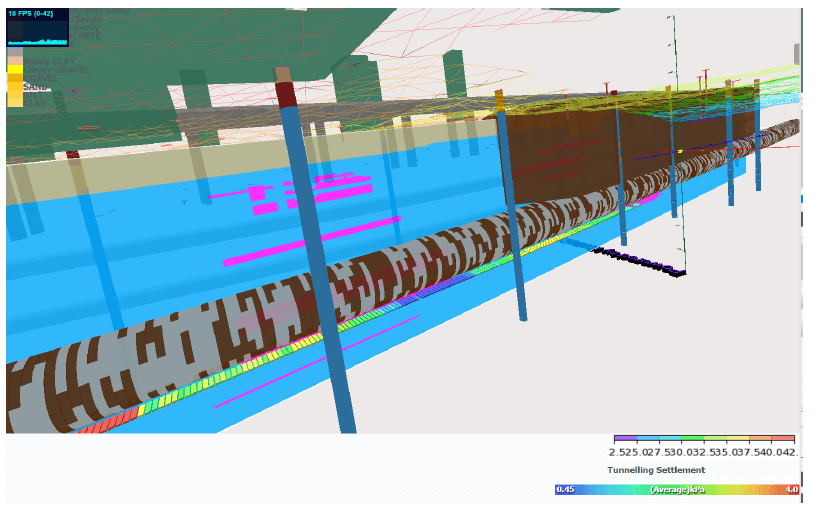
Monitoring objects are also queried to record the impact of tunnelling at the tunnel passes a point and can record the observed settlement and back analyse the face loss through integration across a perpendicular section. Ground water pressures during tunnelling can also be recorded.
Now in an easily analysable format, the data can be described statistically and investigated for cross correlations. These are the basis for future forecasting.
The data can also be combined with other data sets from other projects as required.
Analytical Models in MissionOS:
The data model configuration tool can be used to define any data model. Within these models calculation fields can perform any calculations and can receive constants and variables from any other data model or job related prediction via various lookup functions. This gives the user full control over how prediction models are updated as data becomes available.
Connecting External Analytics to MissionOS:
Whilst MissionOS is a powerful tool for developing analytics we understand that our clients may wish to create their own external applications. We fully support this and have two ways to provide this.
API connection:
MissionOS is built on a rest API framework which you can embed in your applications in Excel or Python to fetch data directly from MissionOS analyse and return data to MissionOS for updating prediction or recommended values.
Connecting MissionOS to External Analytics as DLL.
If you want control of the analytic to be seamless from within MissionOS (note our contouring works in exactly this way) then we can help you to create a callable .DLL. The code is still secure and hosted by you, but is called with credentials from within MissionOS.
Examples
Design information is also linked to the progress of excavation objects and is linked to instrumentation and geology through useful feedback graphs and interfaces.
Python and R: MGS develop a number of tools within Python and R and can provide training and custom development as required.
Excel Solver: We have several examples where Excel has been used as a tool for basic analytics and has automated the back analysis of geotechnical problems using Powerquery operating on the MissionOS API and linking to the Excel solver.
Maxwell GeoSystems has both in‐house capabilities and relationships with universities including the Colorado School of Mines to provide advanced analytics through consulting services and MissionOS. Advanced analytics include geostatistics, autonomous control and machine learning / artificial
intelligence.
Autonomous Control:
MissionOS interfaces can be designed with built in logic to advise the system on optimum parameters to use to achieve desired goals. Whether you need to optimise soil conditioning parameters, maintain face support pressures, ensure adequate backfill grouting or automate TBM navigation, MissionOS can be used to provide feedback, notifications and recommendations to TBM operators.
Geostatistics:
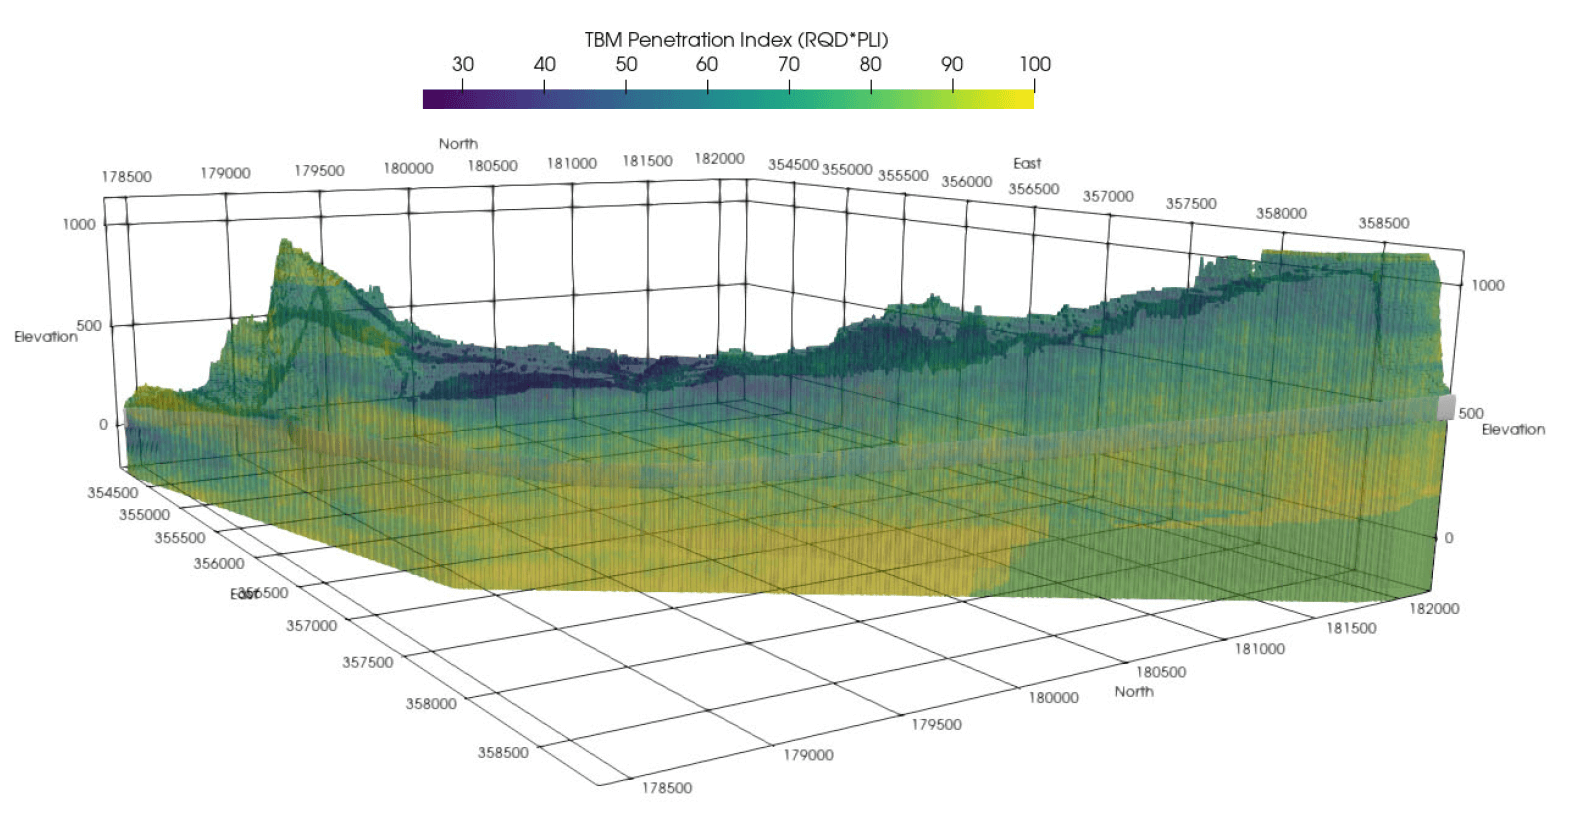
We provide know‐how and experience to assist you with reducing risks pertaining to geotechnical interpretations and subsurface models using geostatistics. This class of applied statistics used to analyse the spatial relationship of data and provide quantified measures of uncertainty in the interpretation, leading to improved risk assessments and mitigation planning.
Machine Learning / AI :
Our data warehouse provides ample opportunity to apply machine learning techniques to extract meaningful information to guide construction and business decisions. With the tunnel data structured in MissionOS, Big Data analysis can be undertaken immediately, without the need for extensive time organising and structuring the data. We also assist in tool development and cloud computing solutions to achieve your machine learning / artificial intelligence objective.
The team at MGS have developed applications in several areas of machine management.
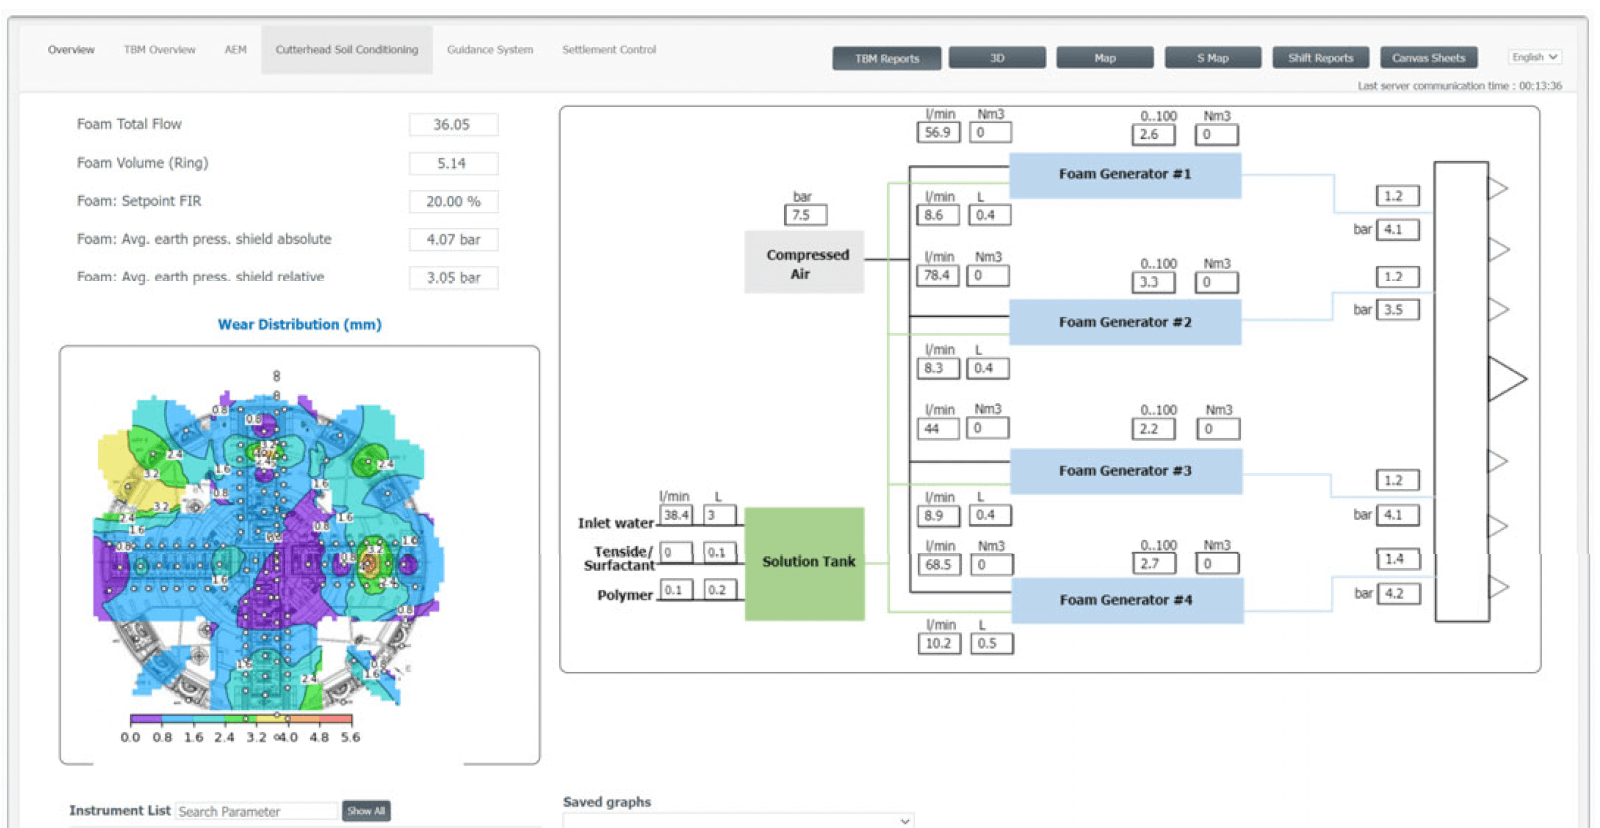
Soil Conditioning and Cutter wear
On the Singapore Power Cable Tunnels regular cutter wear measurements were fed into the MissionOS on each intervention and were used to forecast the rate of wear per m at each tool position normalised for the travel distance of the cutter. With this forecast, interventions could be planned more effectively with an up‐to‐date estimate of the cutterhead health. This work is being combined with research work undertaken by staff at our MGS Denver office linking ground characterisation using geostatistics to the measured data and to TBM parameters used to arrive at new
predicted wear rates along the tunnel.
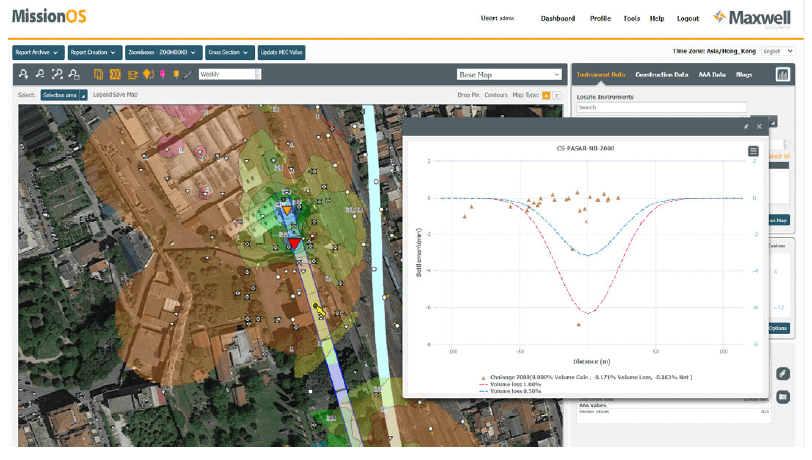
MissionOS has the ability to create dynamic predictions which can be attached to active tunnels and measurement points. These rely on predicted values for the trough width parameter K.
Using the actual settlement data, the GRP_XS_TUN function MissionOS back calculates the face loss by integrating the observedsettlements as the tunnel passes. These data can then be used to inform areas not yet tunnelled as to the most likely K factors to been countered. As settlements deviate from expected behaviours MissionOS provides recommendations for corrective actions through update in the tunnel prediction files.
MGS is building into MissionOS the ability to use predictors to set targets for a variety of parameters and combinations of parameters. These will be either through autonomous feedback systems (such as the settlement system above) or as true machine learning where the machine will identify the optimum parameters to use in certain scenarios. Key focus points include:
Connect directly with a Maxwell GeoSystems support expert via email, or live chat.
Gain access to MGS Learn, the online learning platform for free, self-paced courses on product and topic-based certifications.
Discover all the latest product information on MissionOS and share your experiences with other system users.